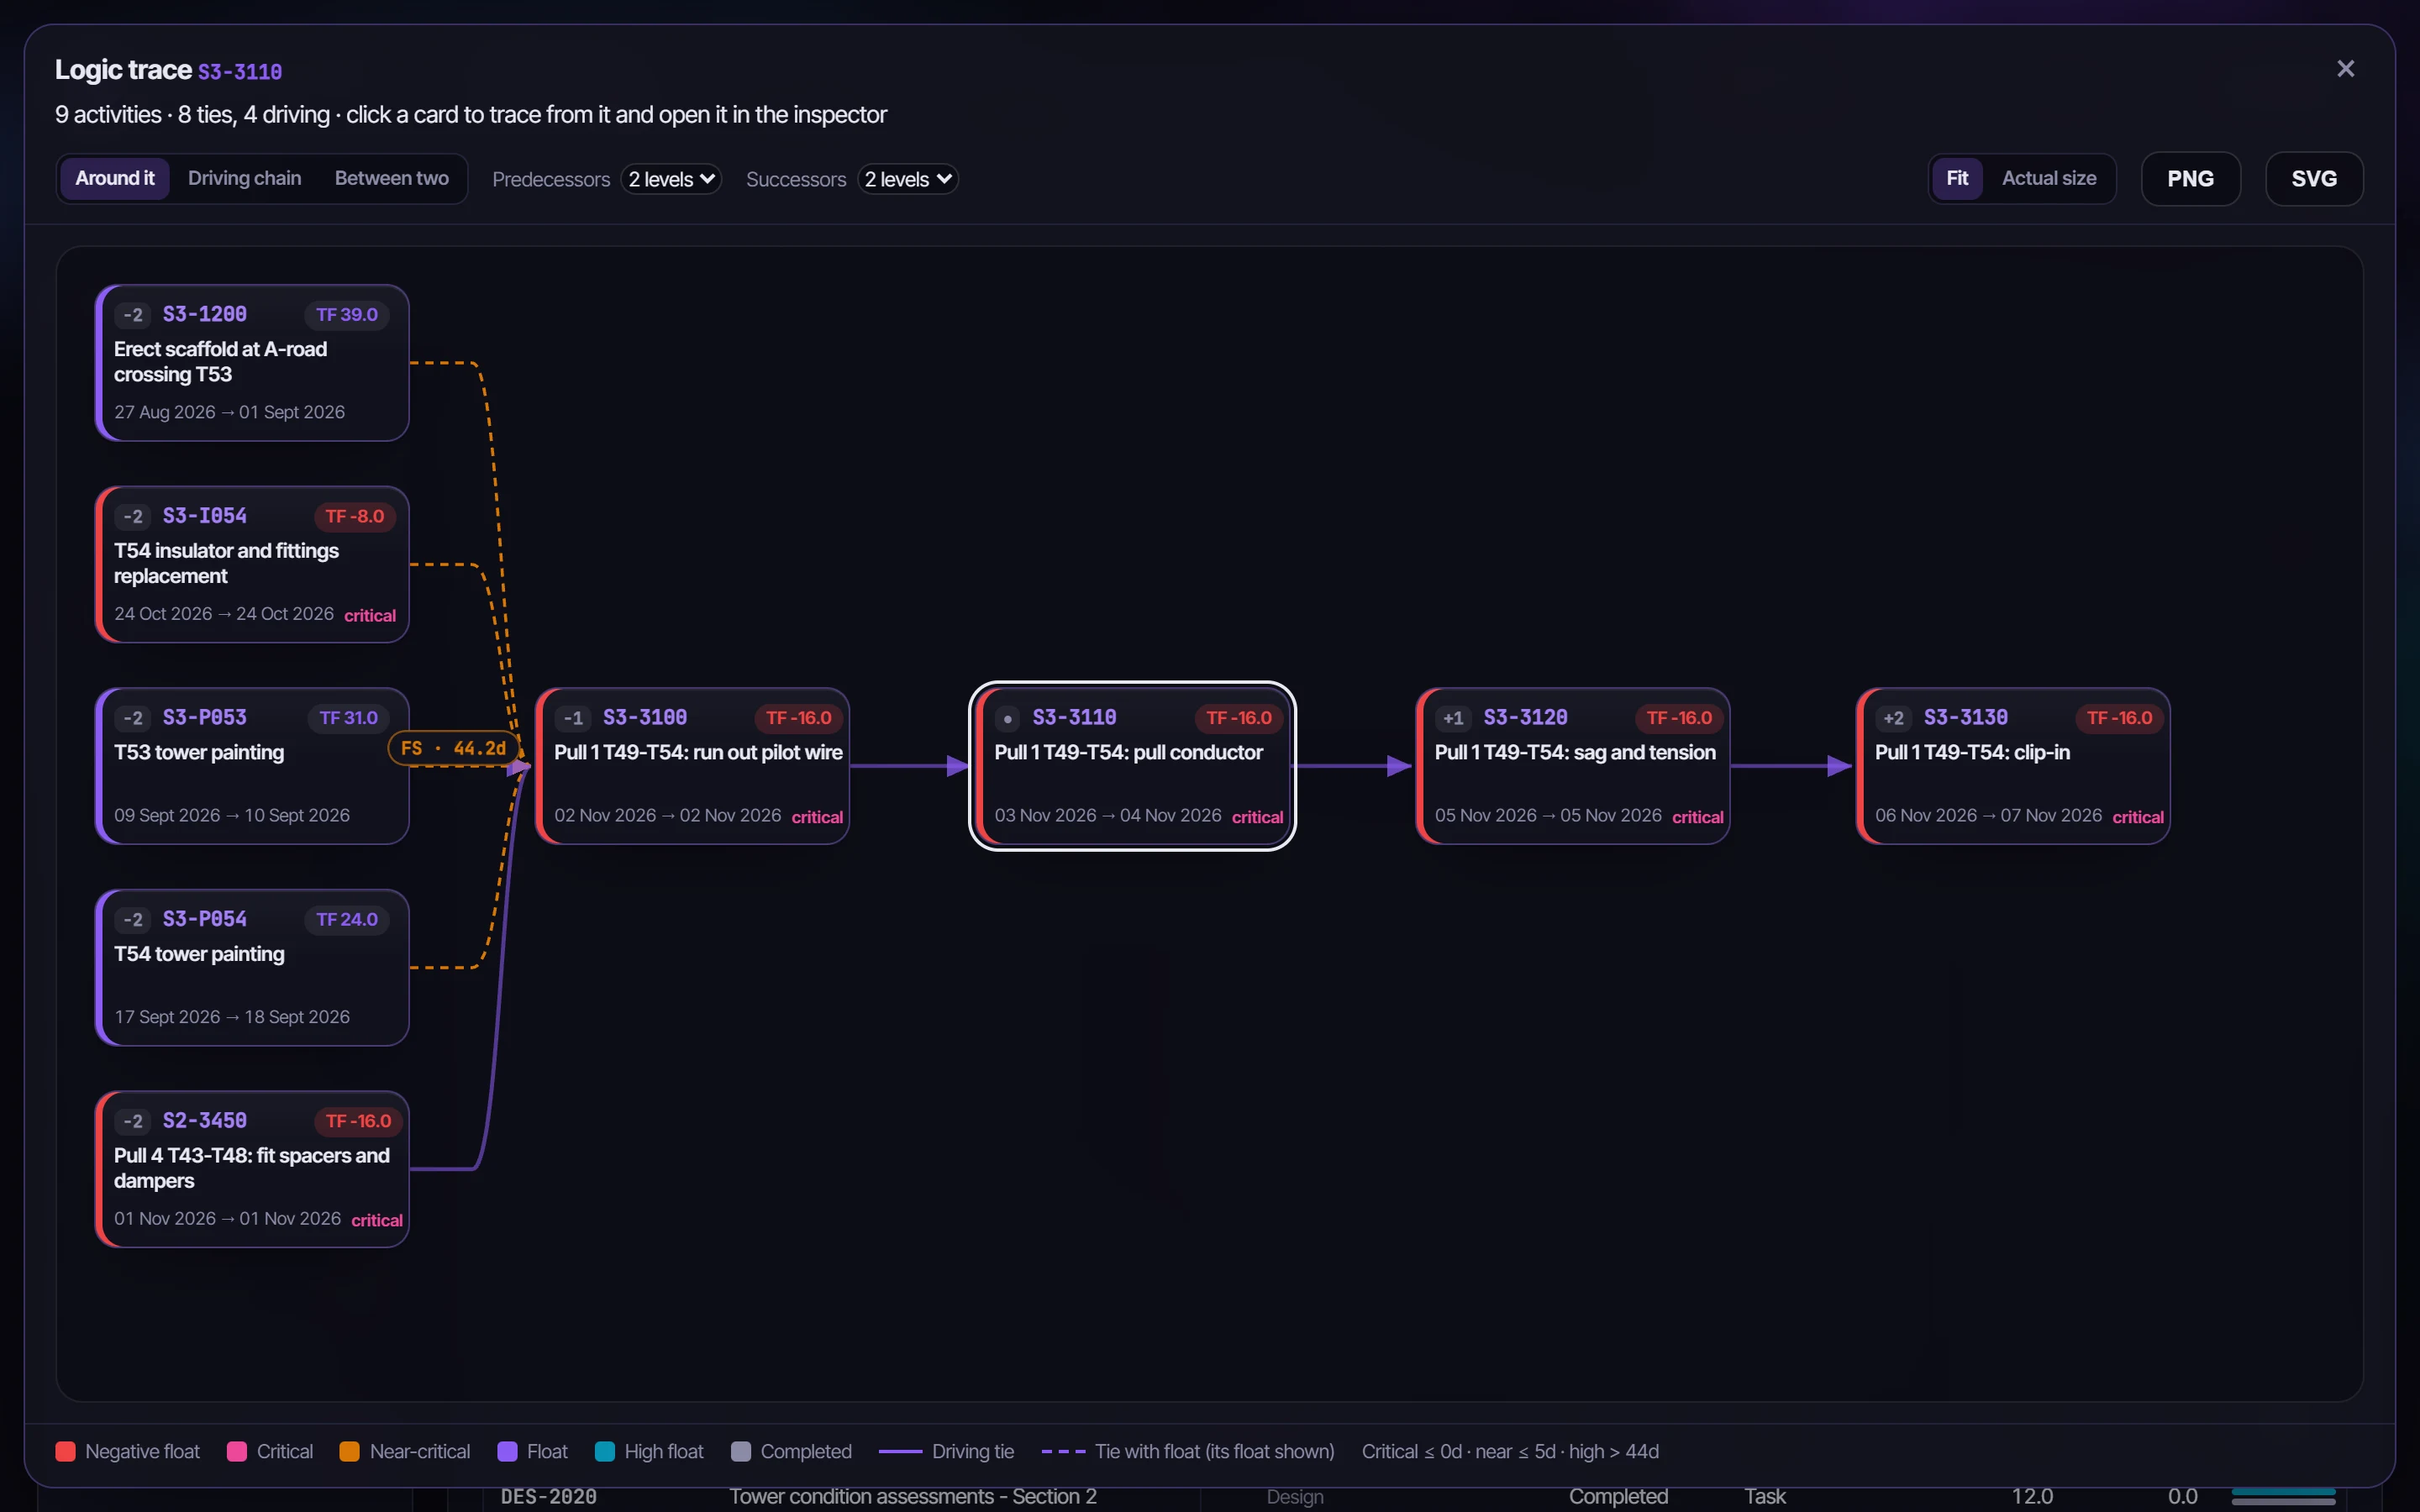
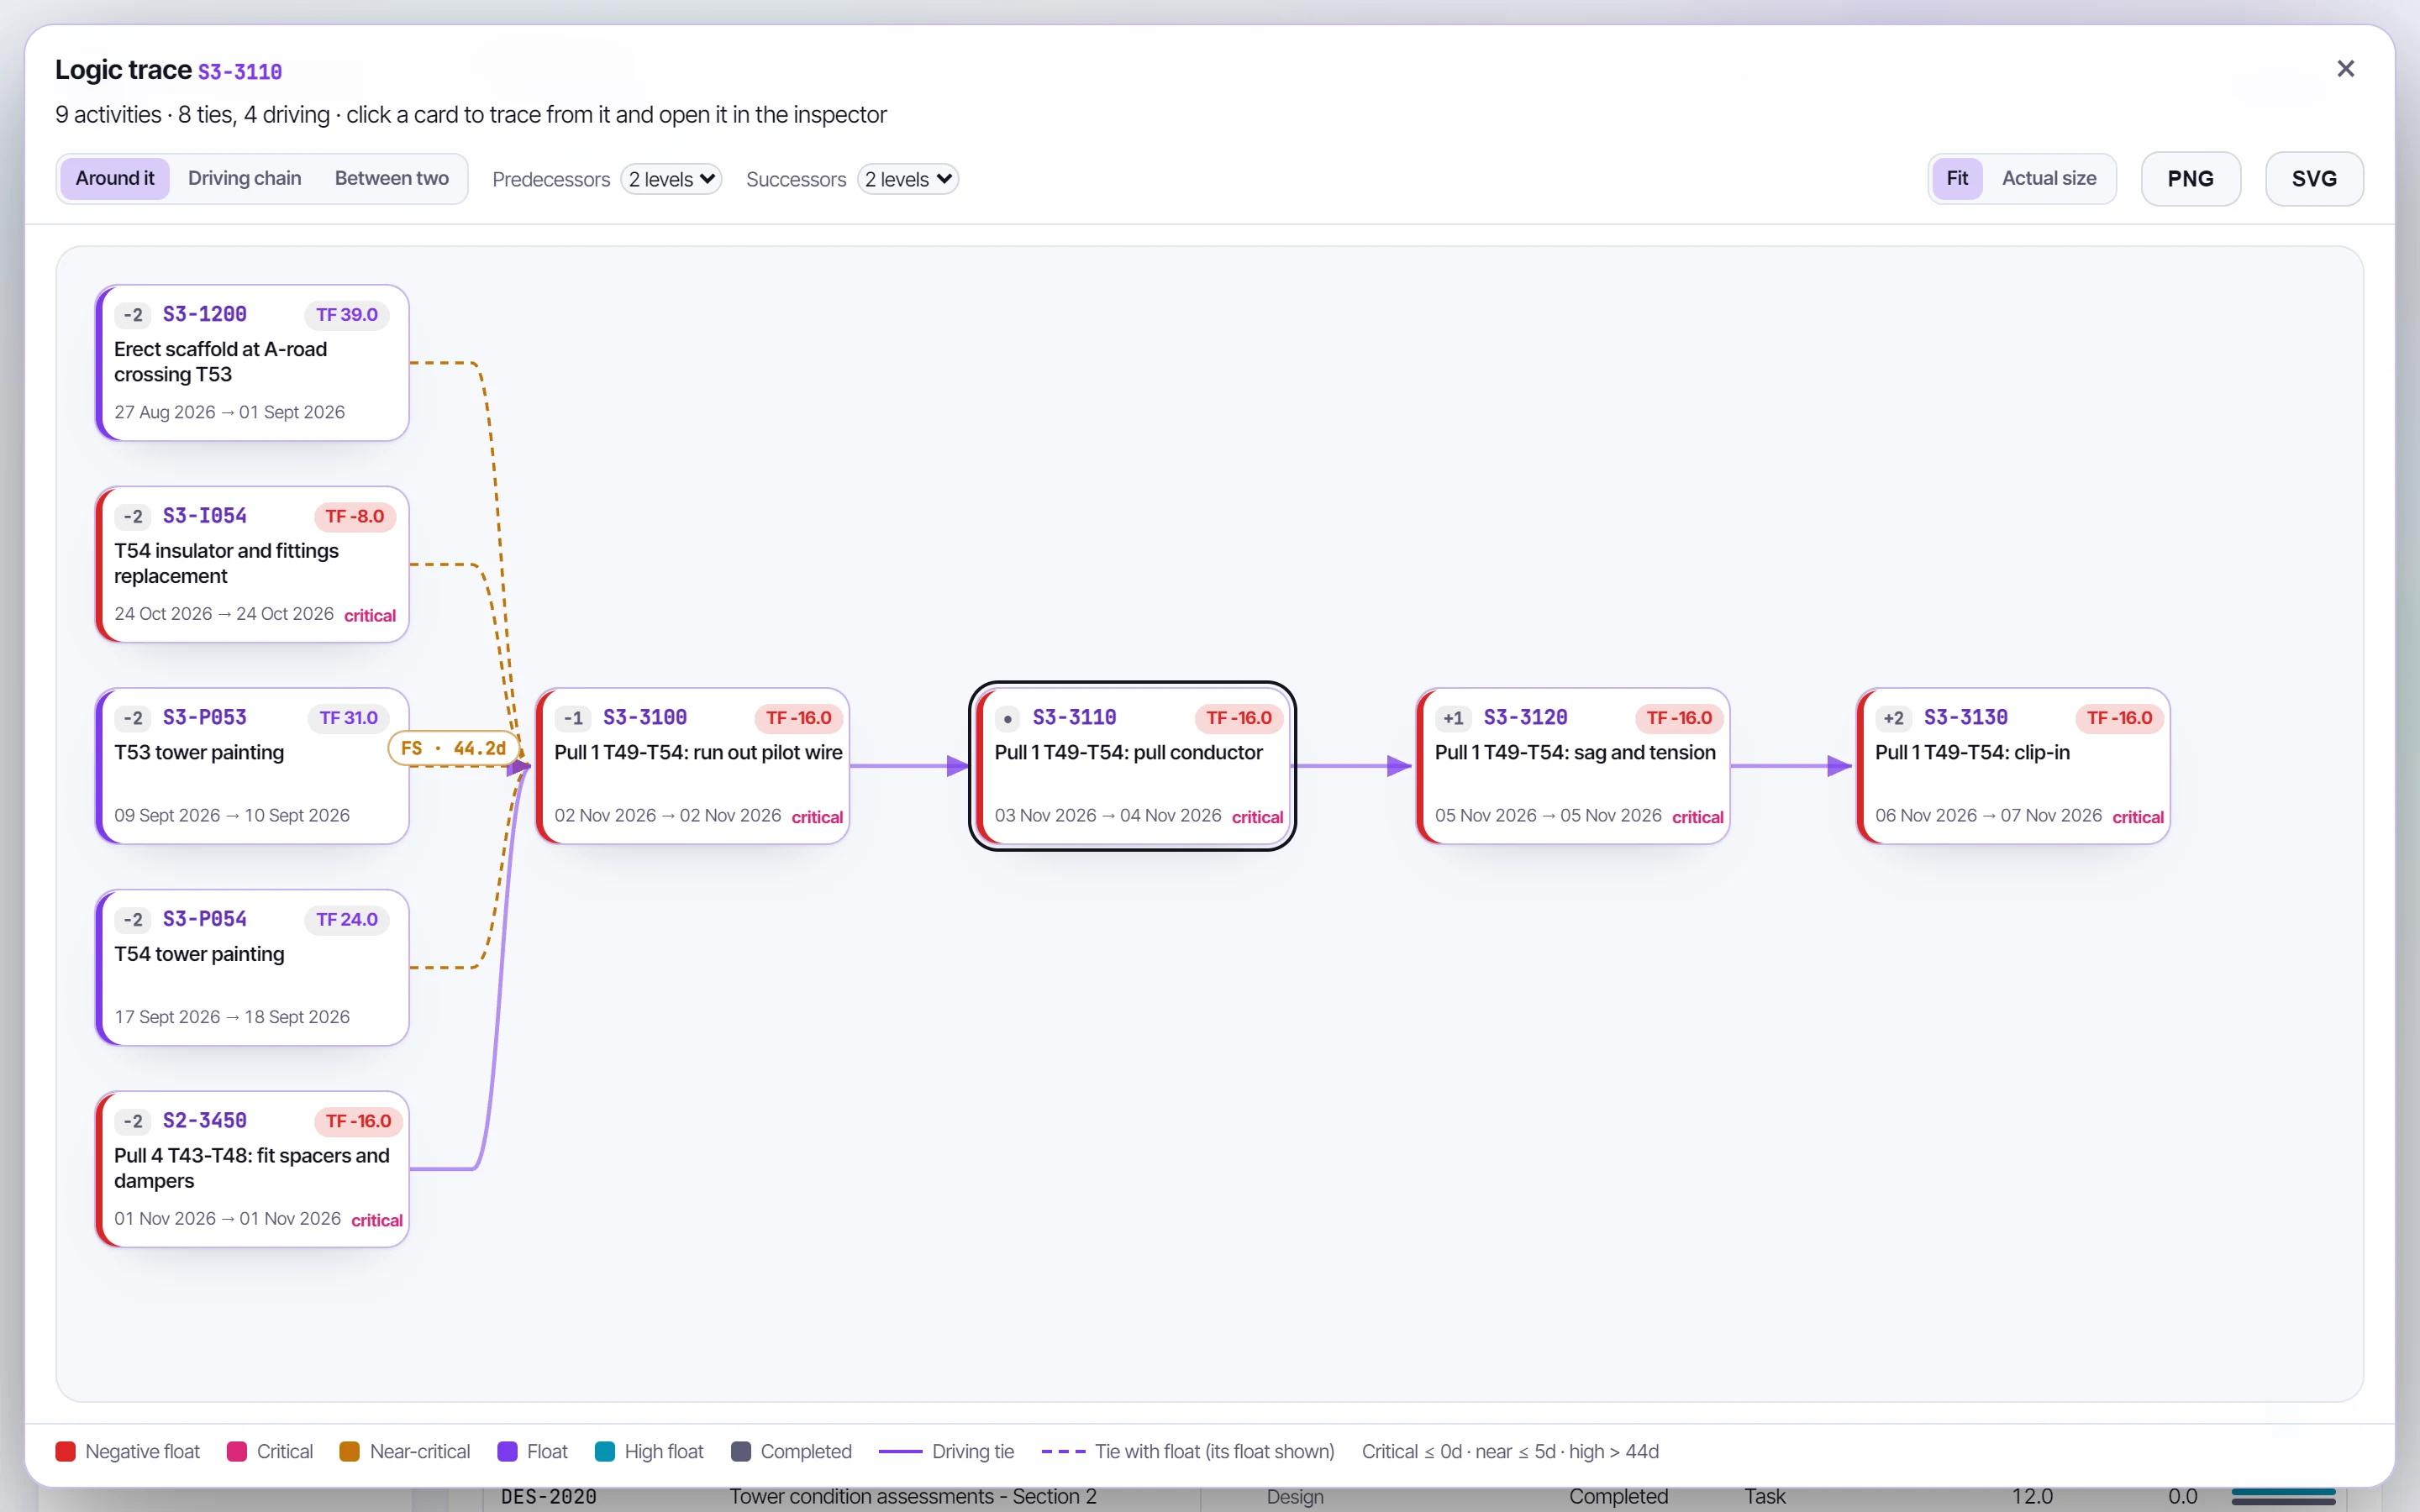
A grid of every activity, as a list or a WBS tree, that stays fast on tens of thousands of rows. Click one to open the inspector, or trace its logic: the network around it, its driving chain to the finish or a Key Date, or every route between two activities.
What it gives you
Float drawn as a bar from zero, % complete against planned %, and a dot for each failed check, right in the grid.
The inspector: dates against plan and baseline, stored and recomputed float, and each predecessor and successor with its relationship float.
Ctrl+K finds any activity, WBS element, code value, NEC4 record or command as you type.
Logic you can read
- Around it: one to five levels each way, with every tie between them.
- Driving chain: how the activity drives the finish or a chosen milestone, through driving ties only, and says so when it doesn't.
- Between two: every route from one activity to another.
- Save any trace as a PNG, or as an SVG for a drawing tool.
Driving, as P6 marks it
A relationship drives when its relationship float is zero on P6's stored dates. When those dates break the programme's own logic, because it wasn't rescheduled, the recomputed dates are used and the trace says so.
Check your next update before anyone else does.
Free for a day. Export an XER from P6 and see what it says.