Analysis
Activities, inspector and logic trace
The activity grid, the inspector, logic traces and Ctrl+K.
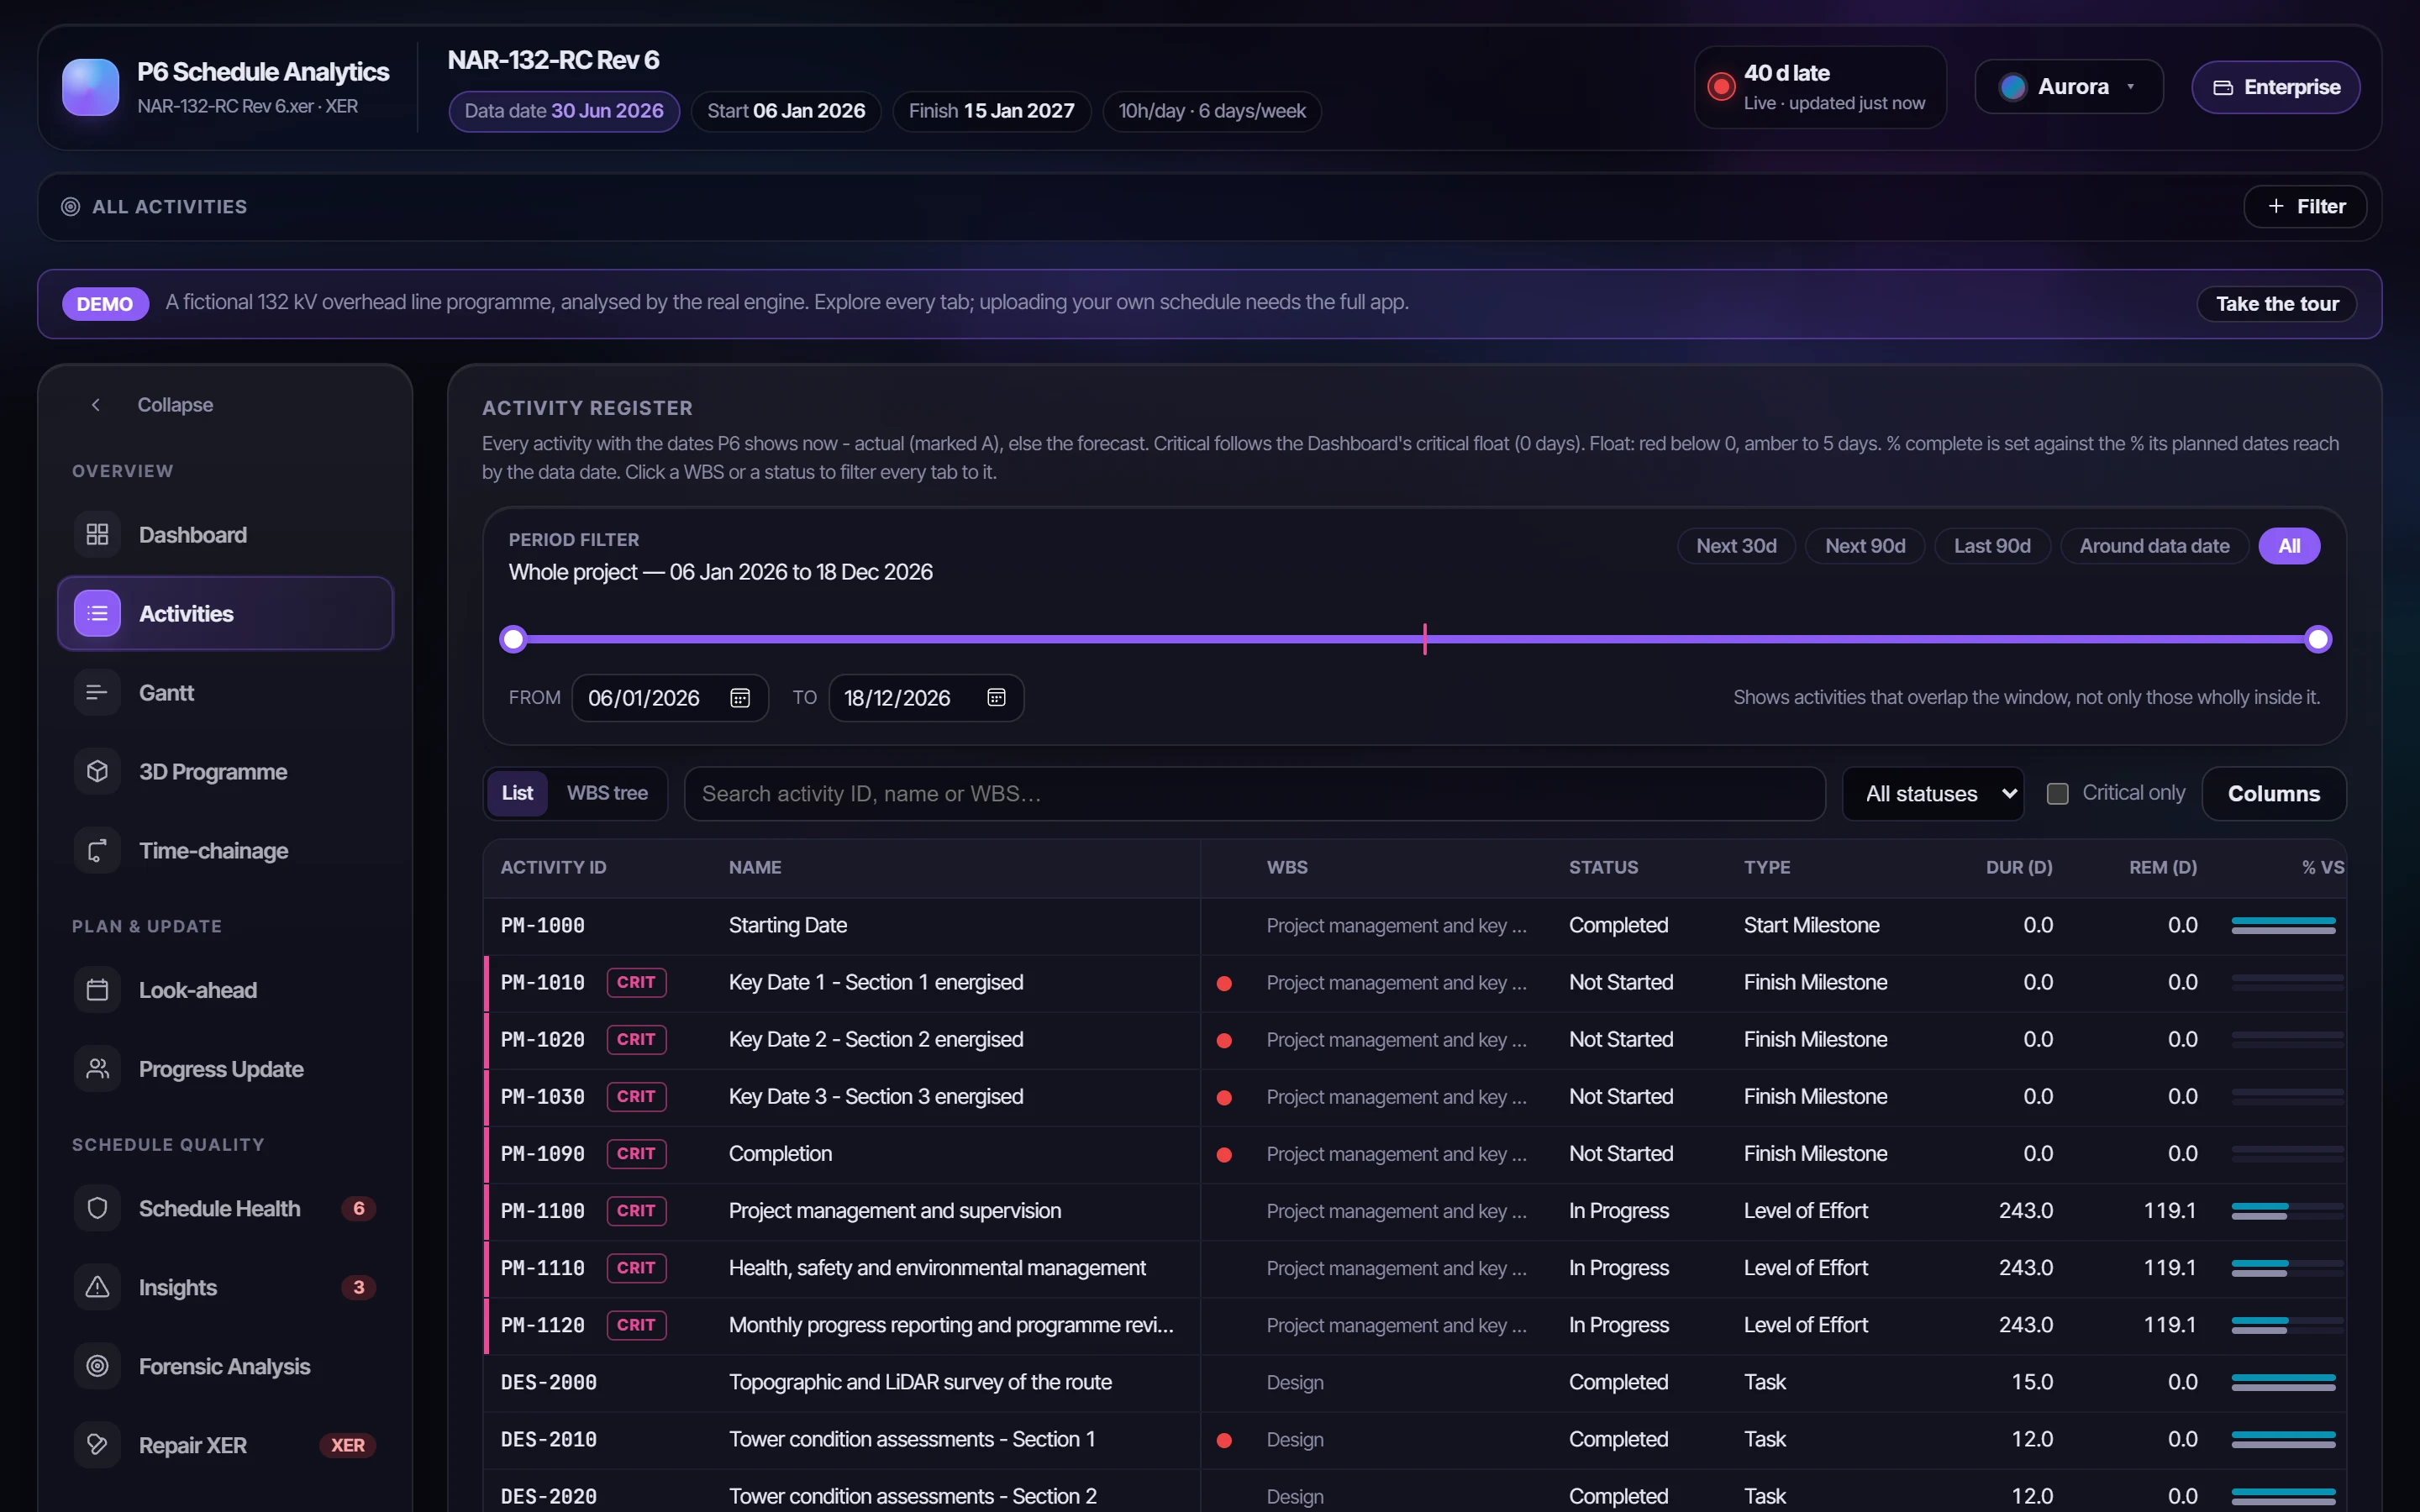
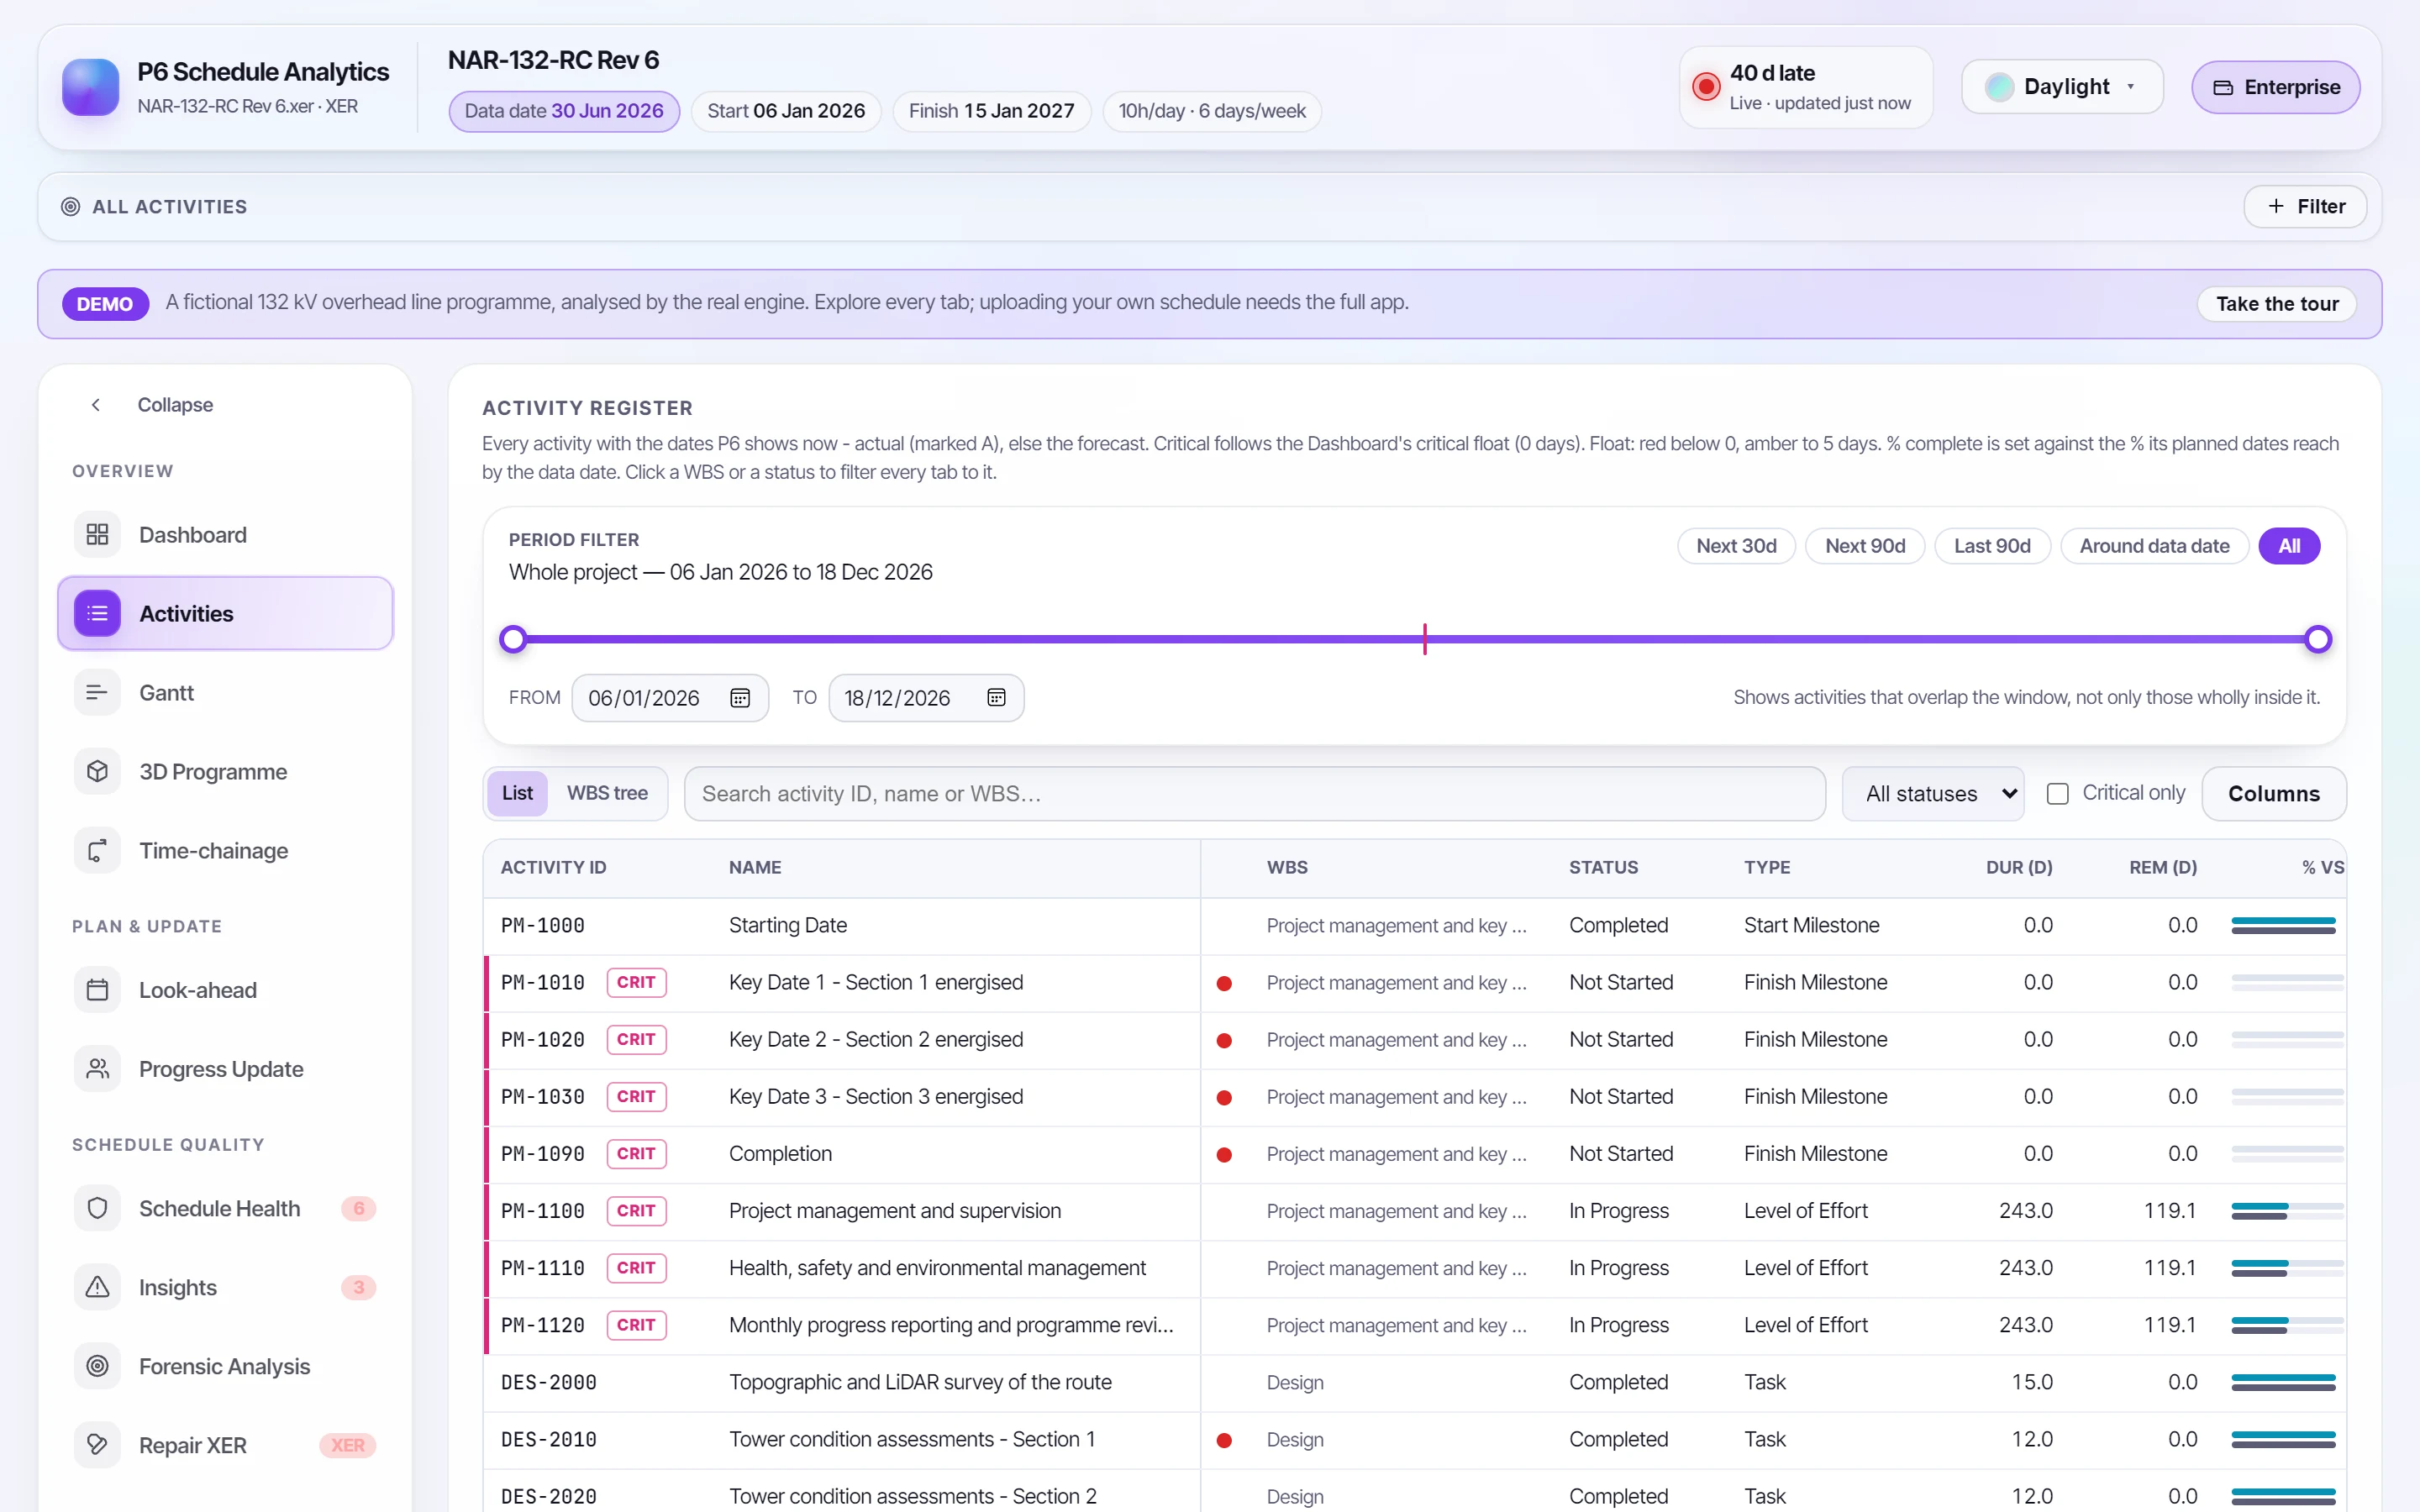
The Activities tab lists every activity with the dates P6 shows now (actual, marked A, else the forecast), the same dates the period filter uses. Click any row to open it in the inspector, or trace its logic.
The grid#
- Every activity at once. Only the rows on screen are drawn, so a programme of 20,000 activities scrolls as smoothly as one of 200. The Activity ID and name stay pinned while the rest scrolls sideways.
- List or WBS tree. The tree follows P6's WBS order. Each element's row rolls up the activities beneath it: the count, the earliest start and latest finish, budget, % complete by duration and the worst float of its open work.
- Small visuals in the cells. Float is a bar from a zero line (red below zero, amber in the near-critical band); % complete sits against planned %, and turns amber when behind; a dot marks an activity a DCMA check failed (red) or an insight names (amber).
- Columns. Choose what to show, free float, planned dates and budget included. The choice is remembered.
- CSV. The download carries the same list, in the same order.
Planned % is how much of the activity its planned dates reach by the data date, on its own calendar: the same fraction that makes the Dashboard's planned value.
The inspector#
Click an activity anywhere (in Activities, the Gantt or the Dashboard's driving path) and the inspector opens beside the page.
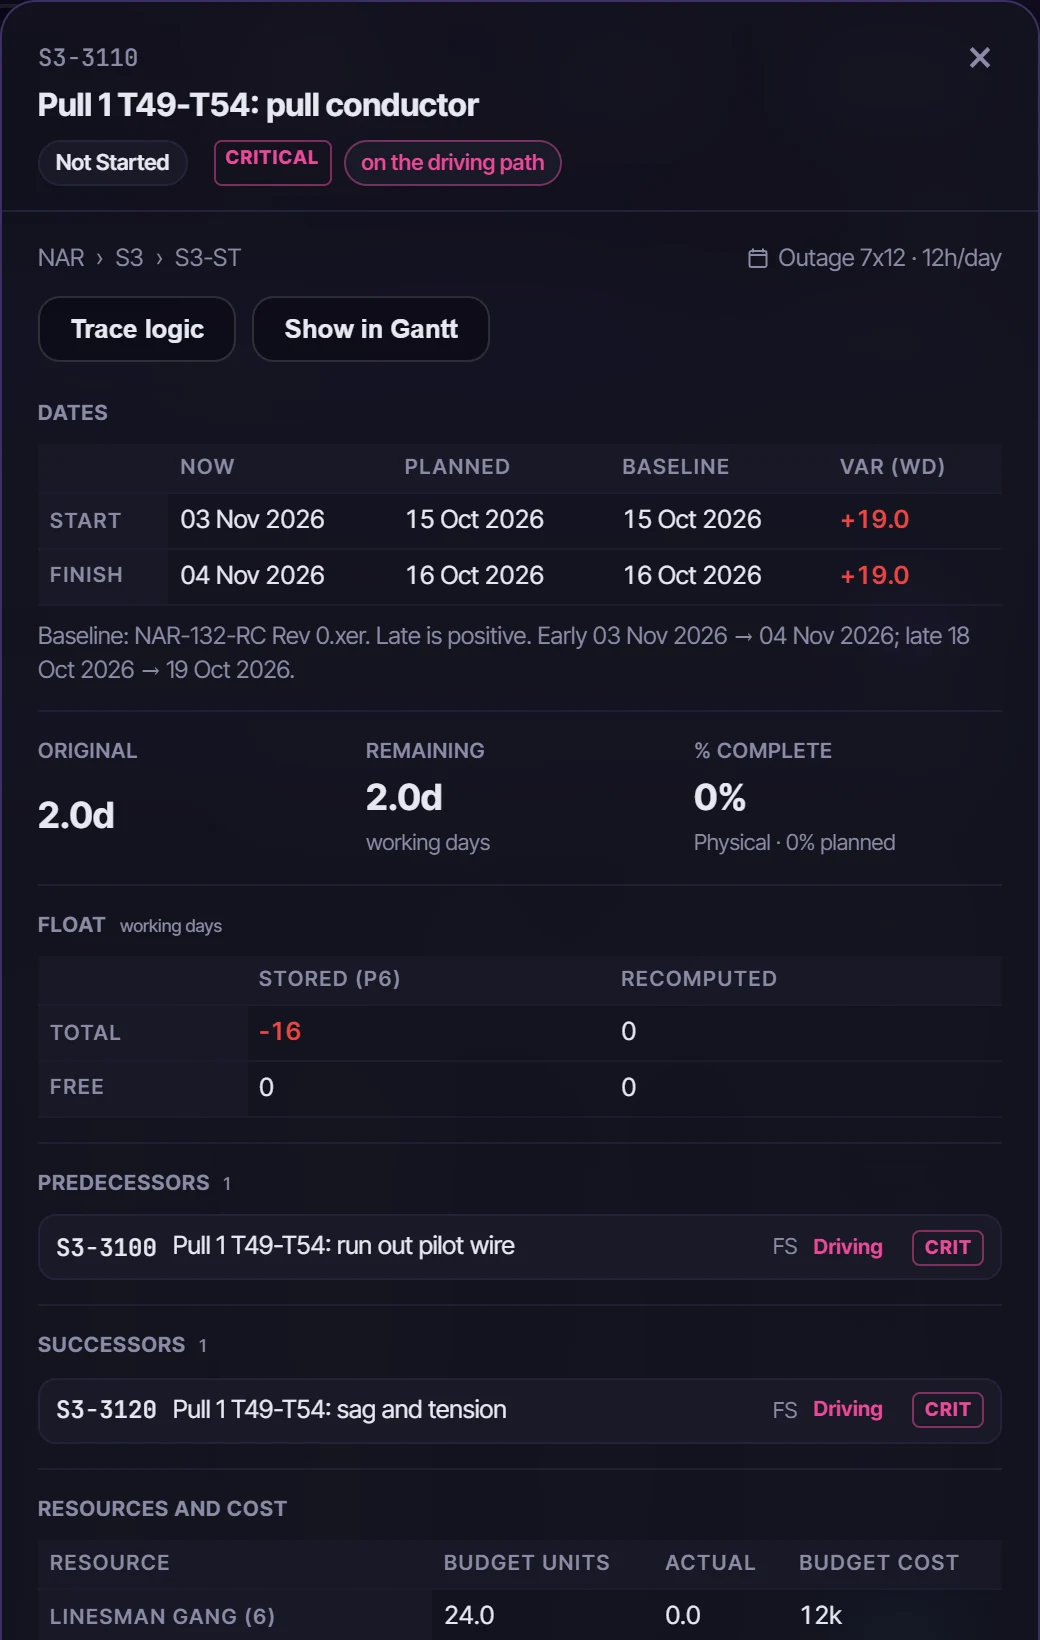
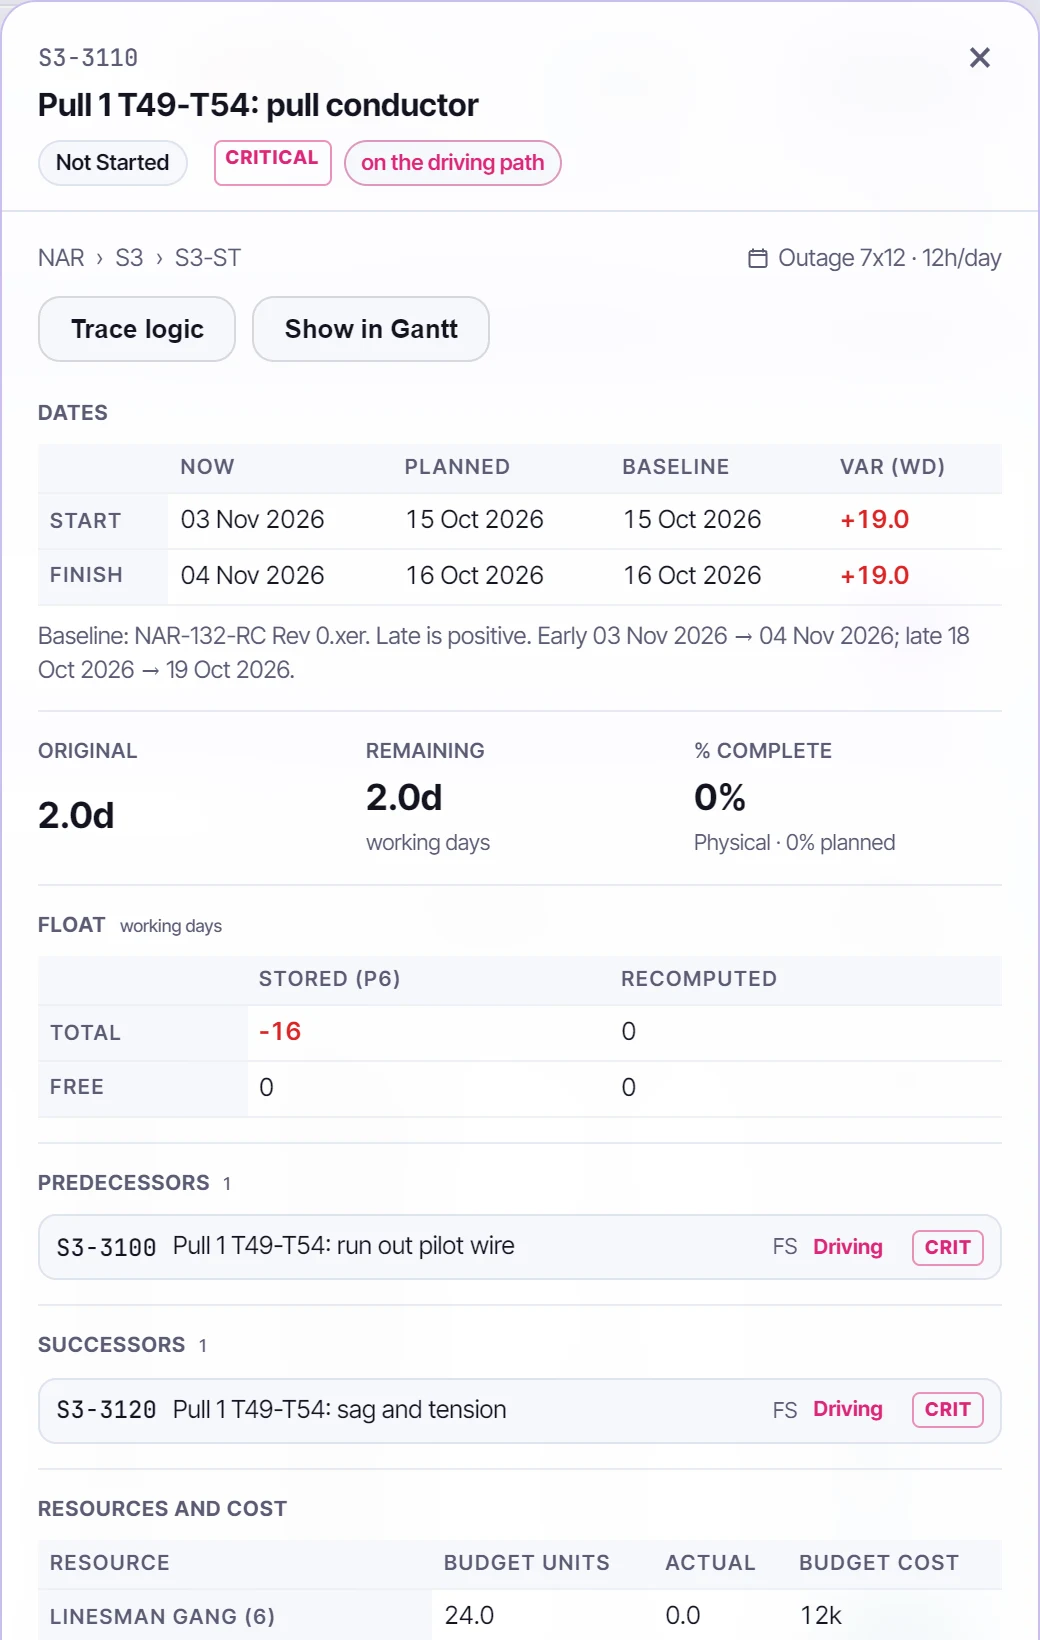
- Where it sits: the WBS path and the calendar.
- Dates: now, planned and baseline, with the variance in working days against the session's baseline.
- Durations and progress: original and remaining duration, and % complete named as P6 names its type, against planned %.
- Float: total and free float as P6 stored them, beside the values recomputed from the logic.
- Logic: each predecessor and successor with its type, lag and relationship float. Driving means a relationship float of zero, as P6 marks it. Click one to open it in its place.
- Resources and cost, the DCMA checks and insights that name it, and with NEC4 the early warnings, instructions and compensation events naming it, the Key Dates it achieves, and whether it is a time risk allowance.
Show in Gantt jumps to the activity, opening its branch and lifting any filter that hides it.
Logic trace#
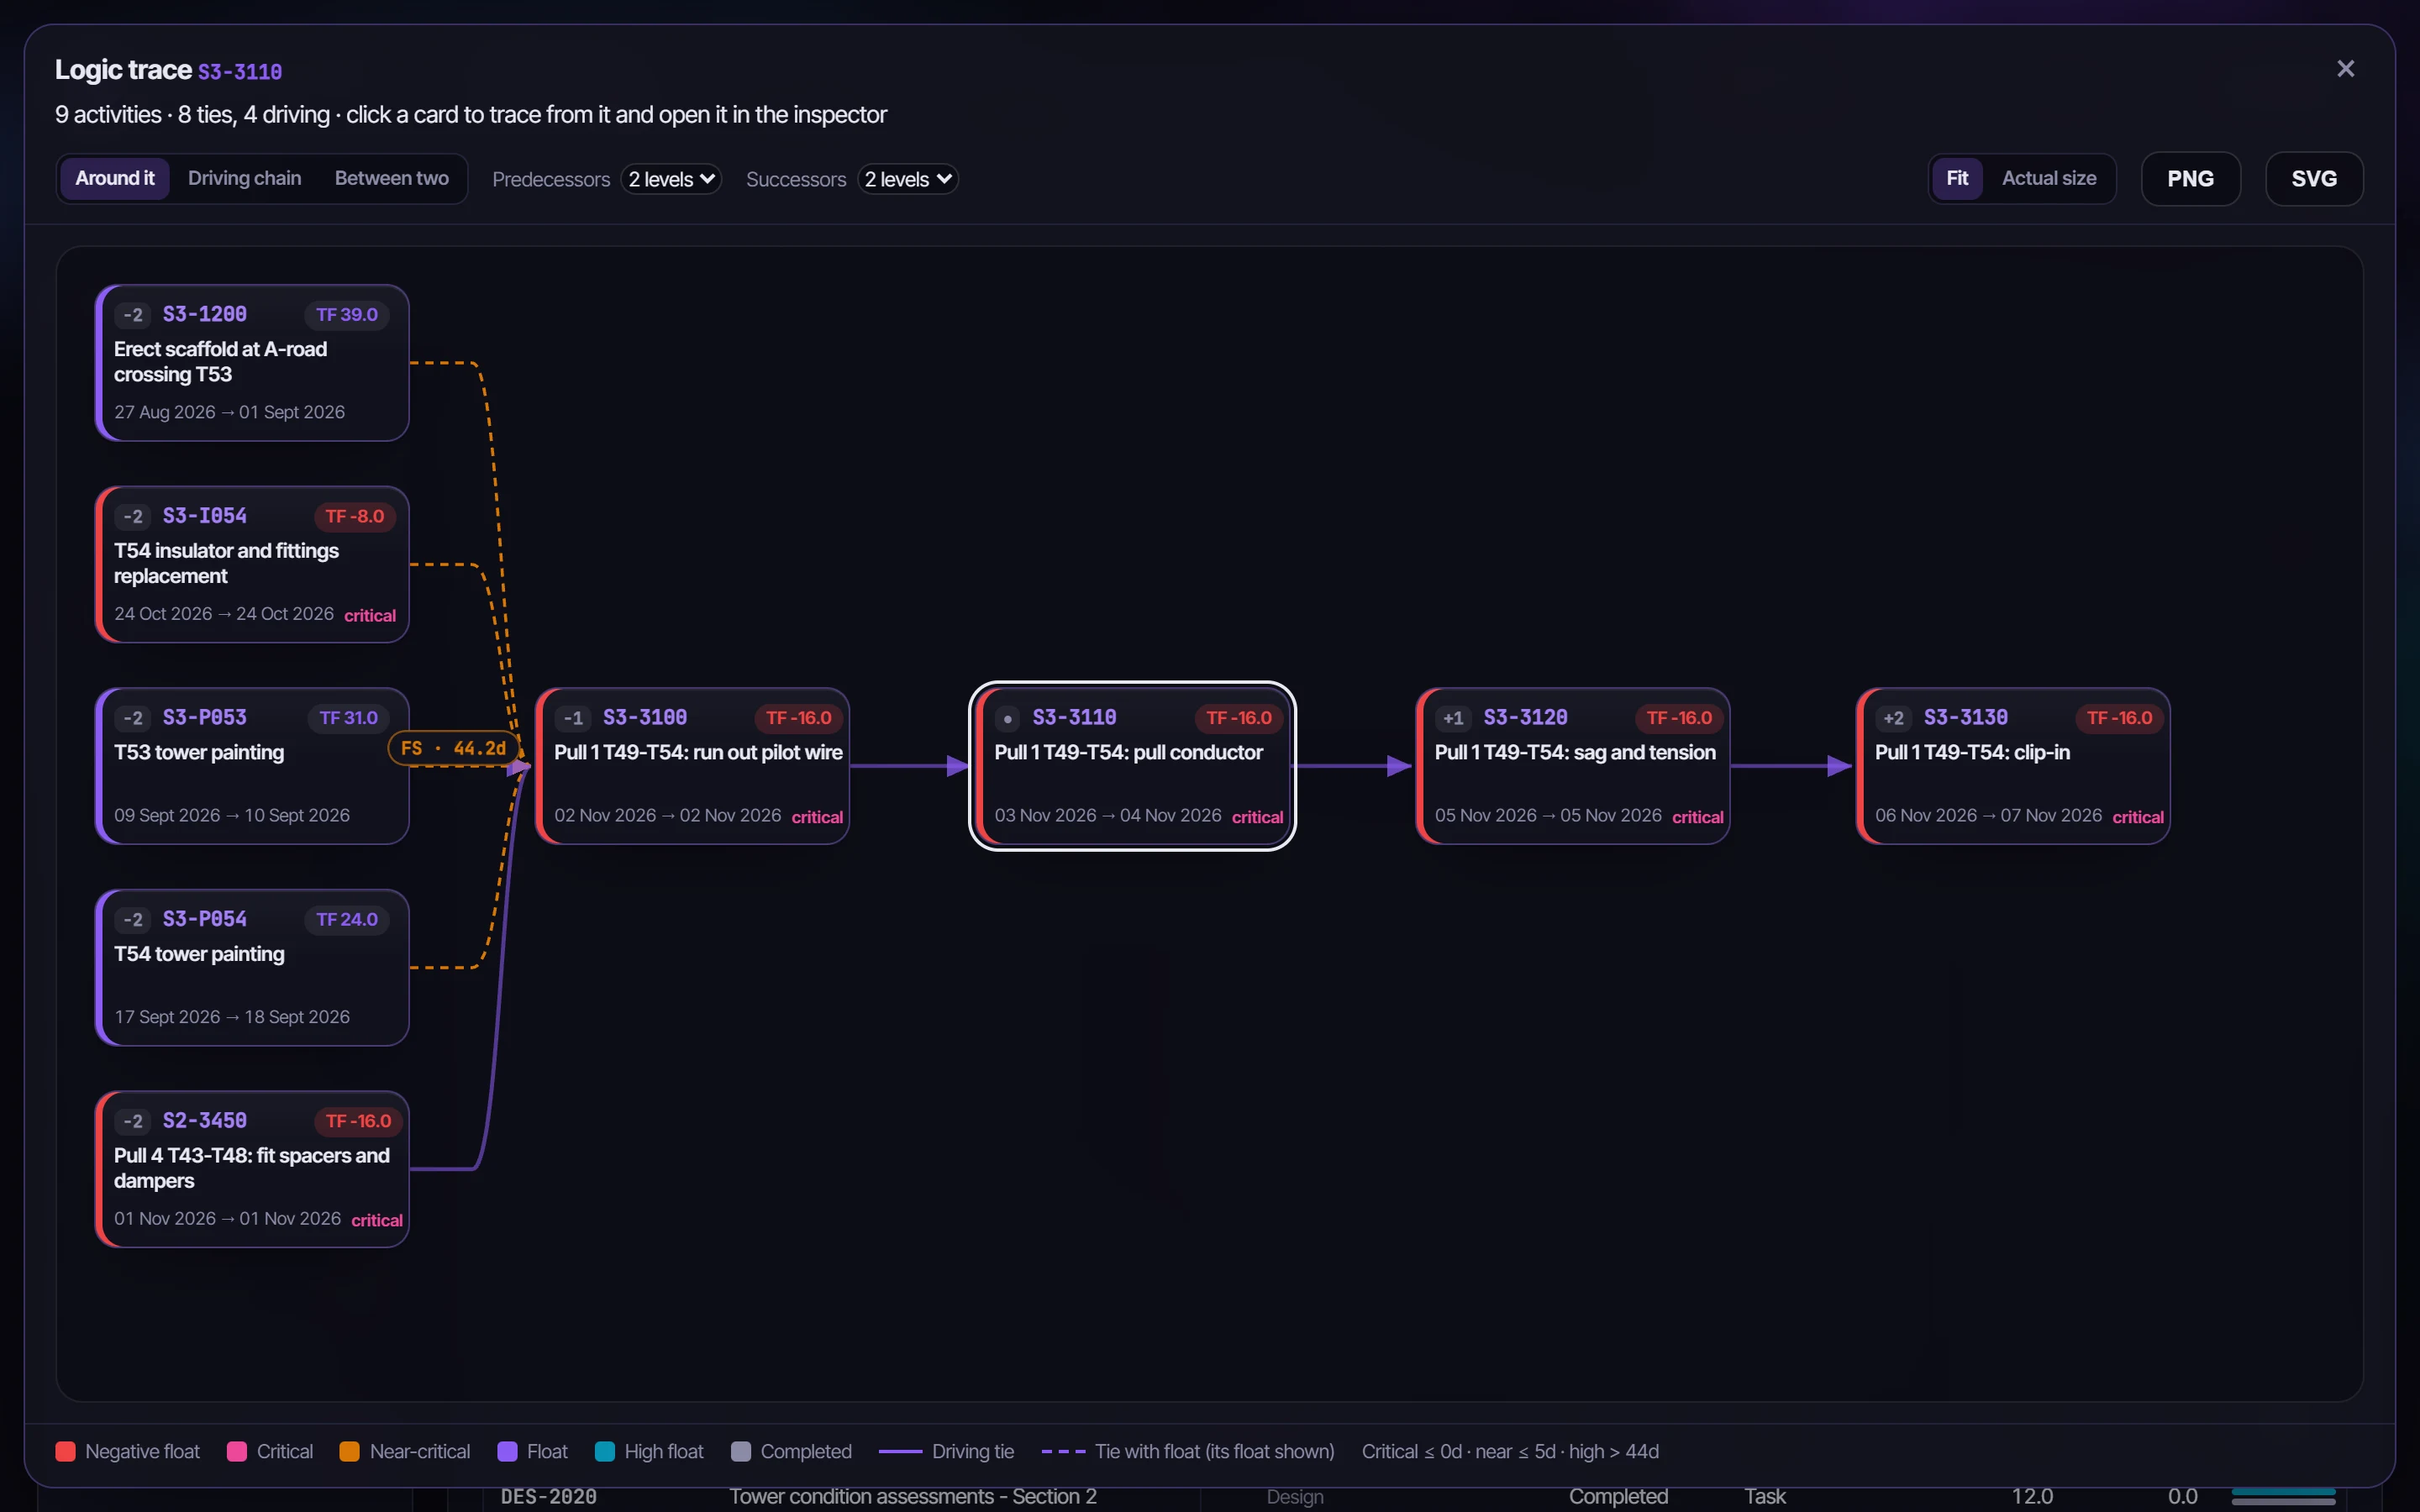
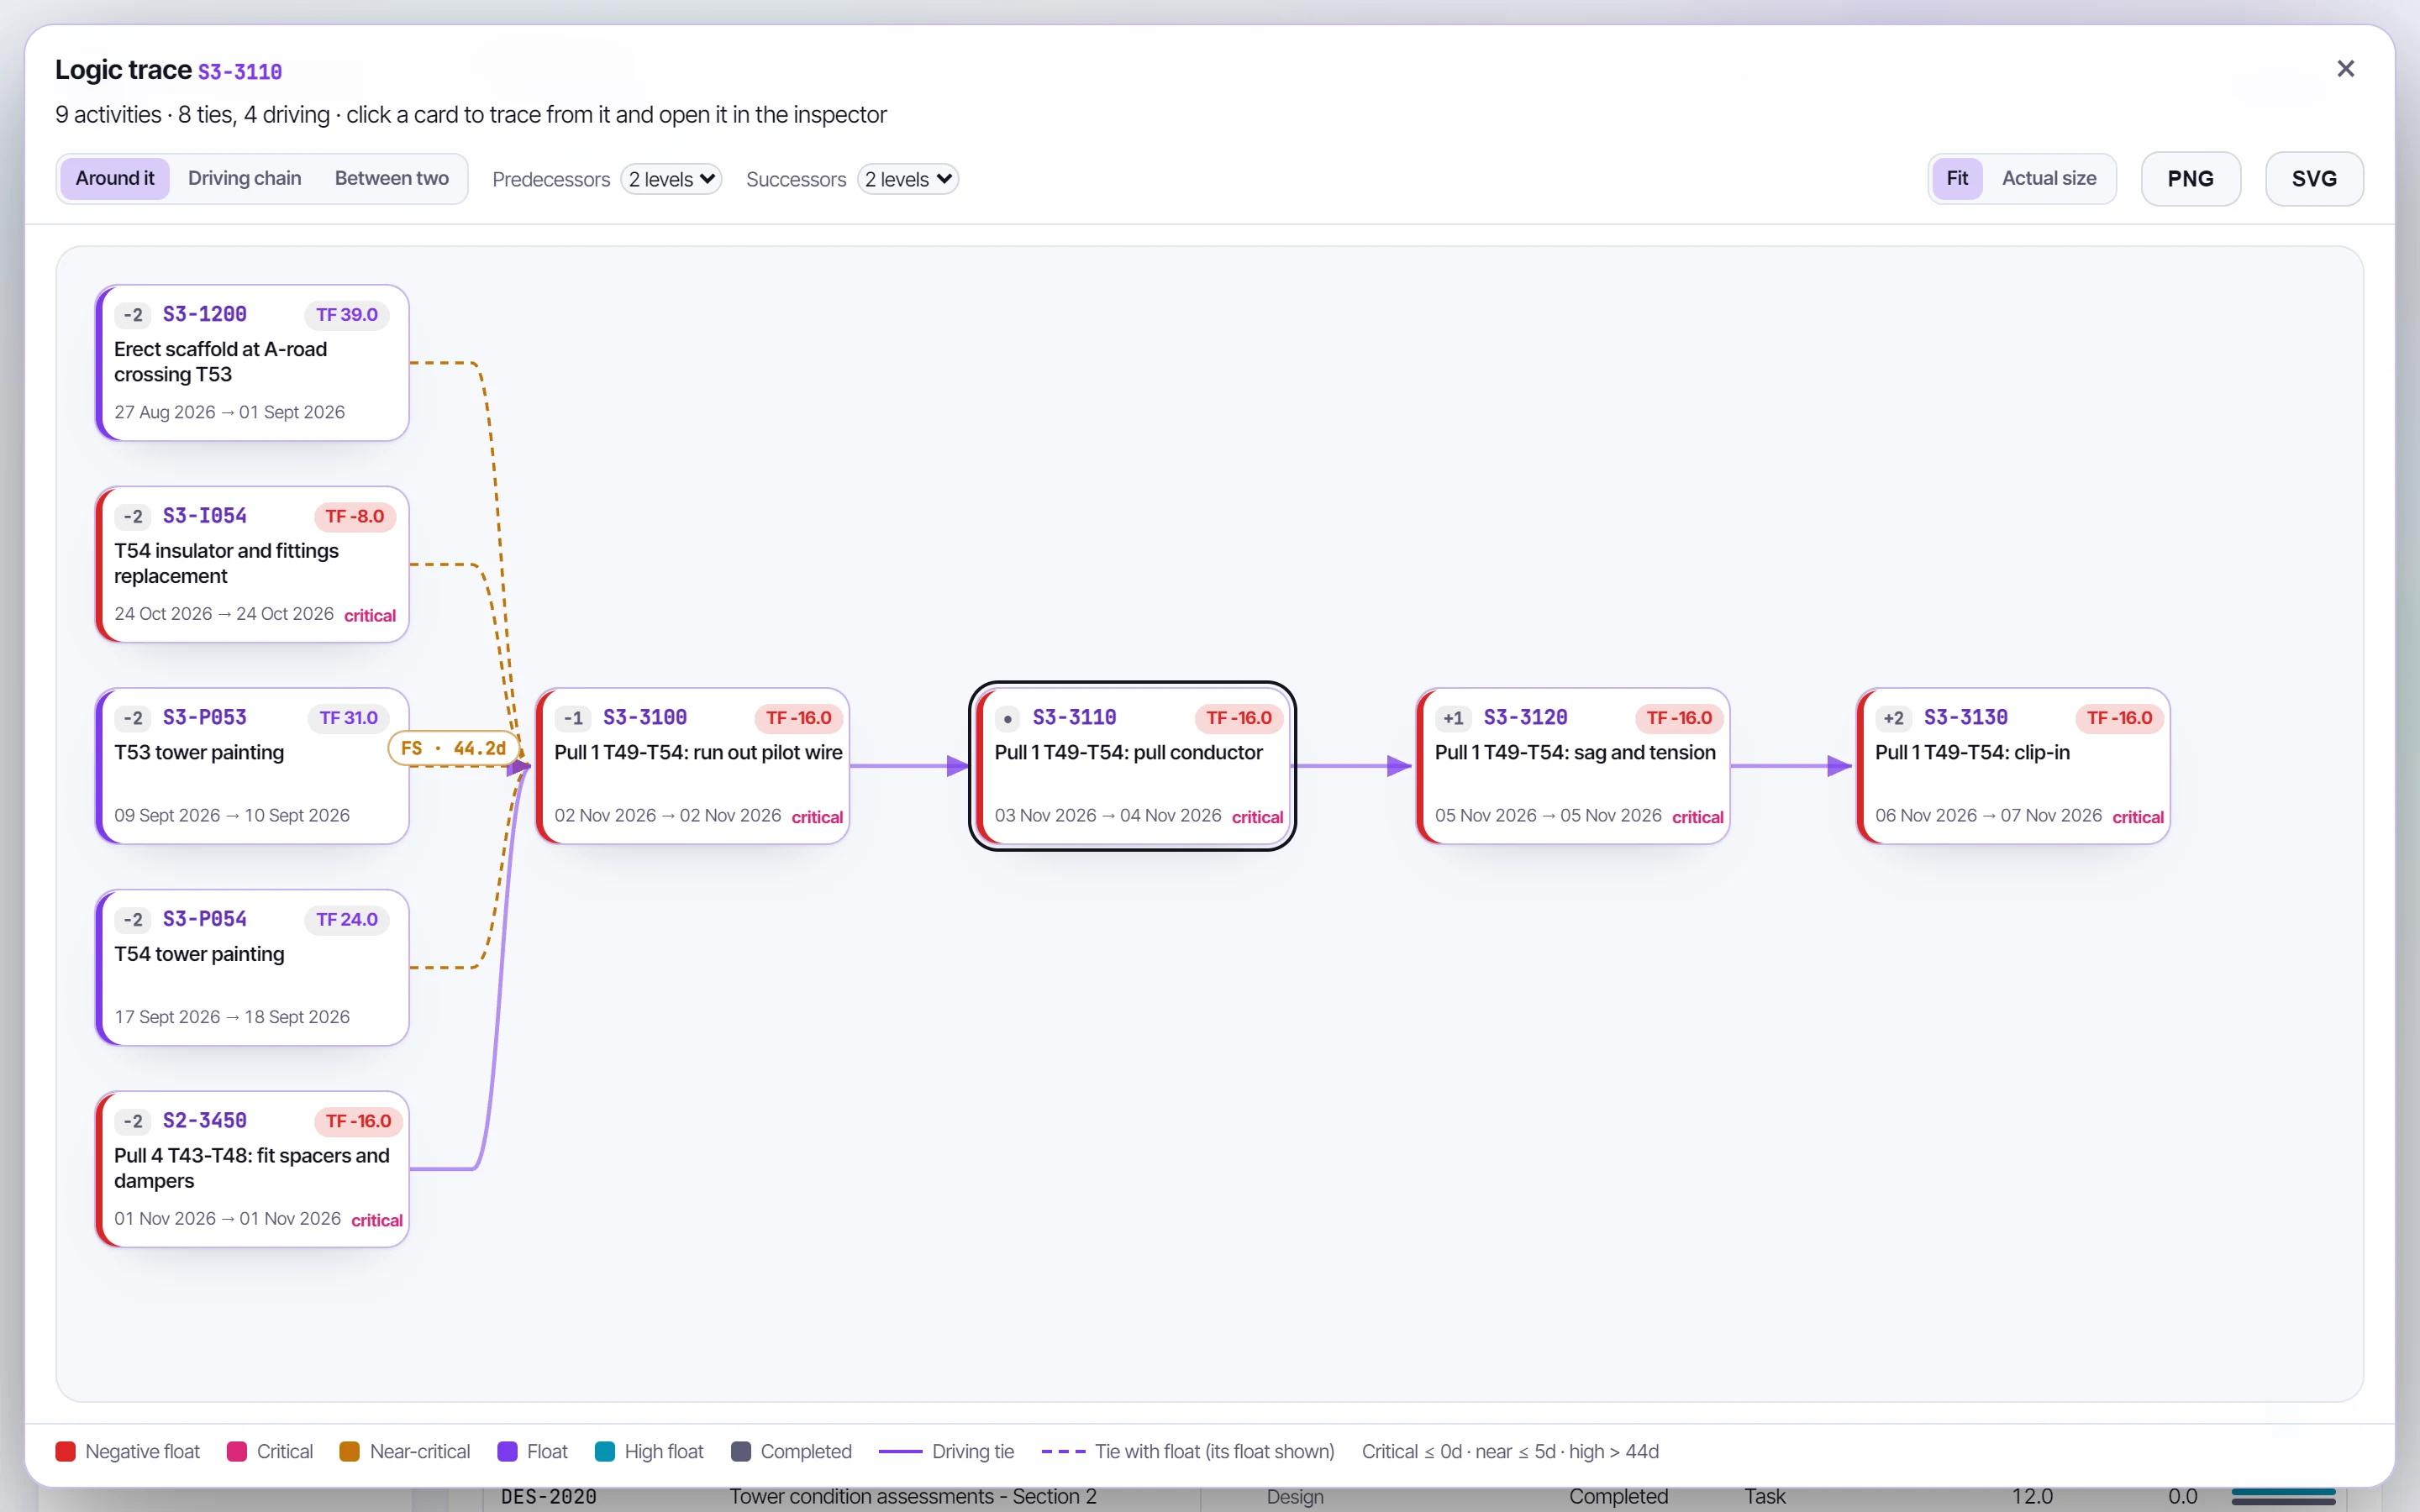
A readable piece of the network around one activity, never the whole of it. Open it from the inspector's Trace logic, the Gantt, the Dashboard's driving path, or Ctrl+K.
| Cut | What it shows |
|---|---|
| Around it | One to five levels of predecessors and successors, with every tie between them |
| Driving chain | How the activity drives the project finish, or a milestone or Key Date you choose, through driving ties only. If it doesn't drive the target, the logic that does lead there is shown, and the trace says so |
| Between two | Every route from one activity to another, either way round |
Cards are coloured by float band on the Dashboard's thresholds; a driving tie is solid and bright, a tie with float dashed with its float shown. Click a card to re-centre the trace on it. Save the trace as a PNG, or as an SVG to edit in a drawing tool. A trace of more than 250 activities keeps those nearest the start and says so.
Ctrl+K#
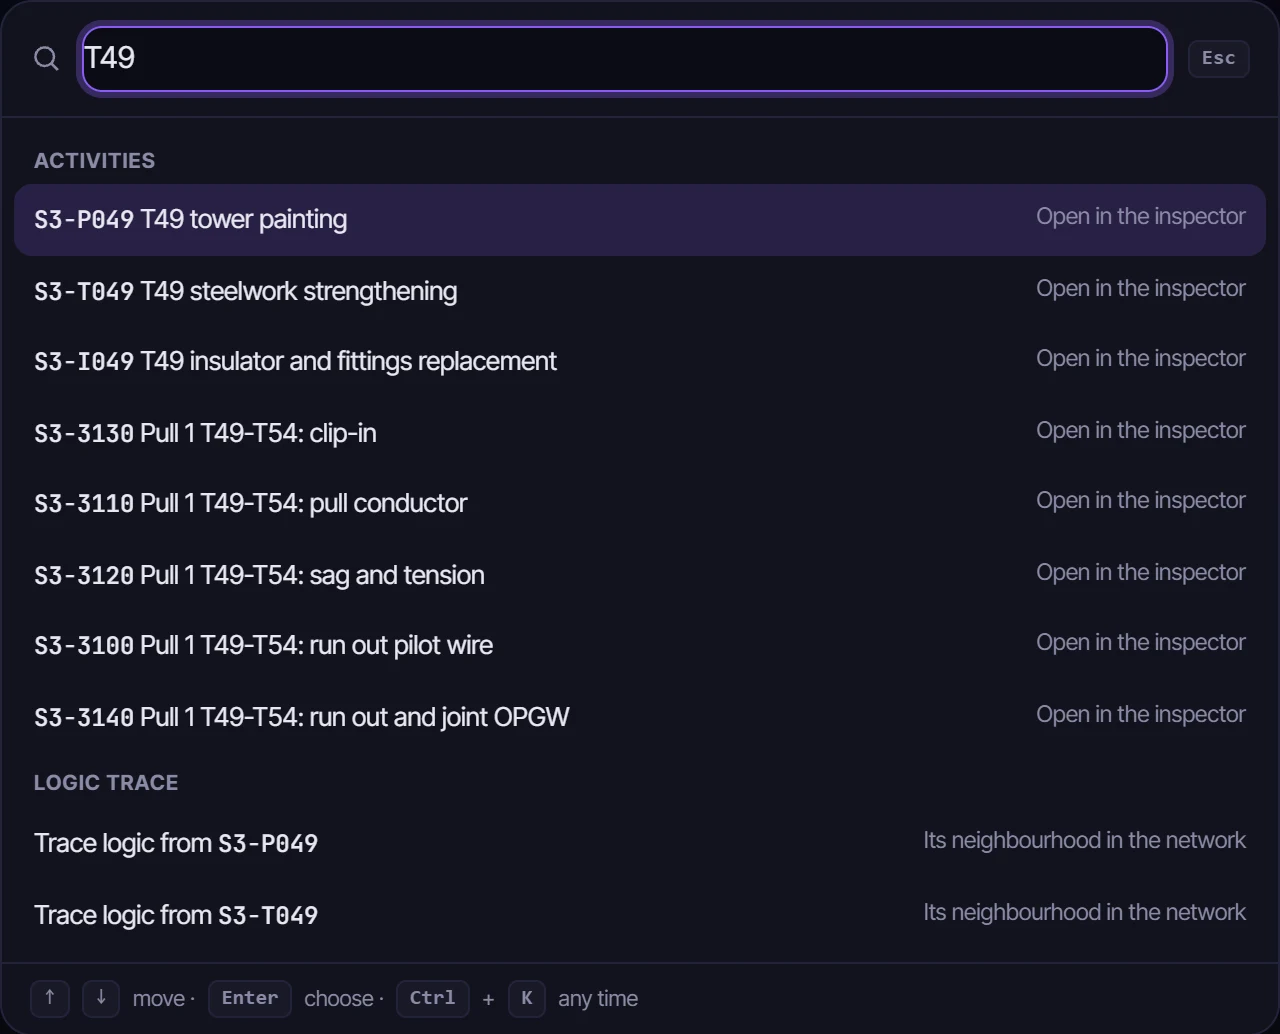
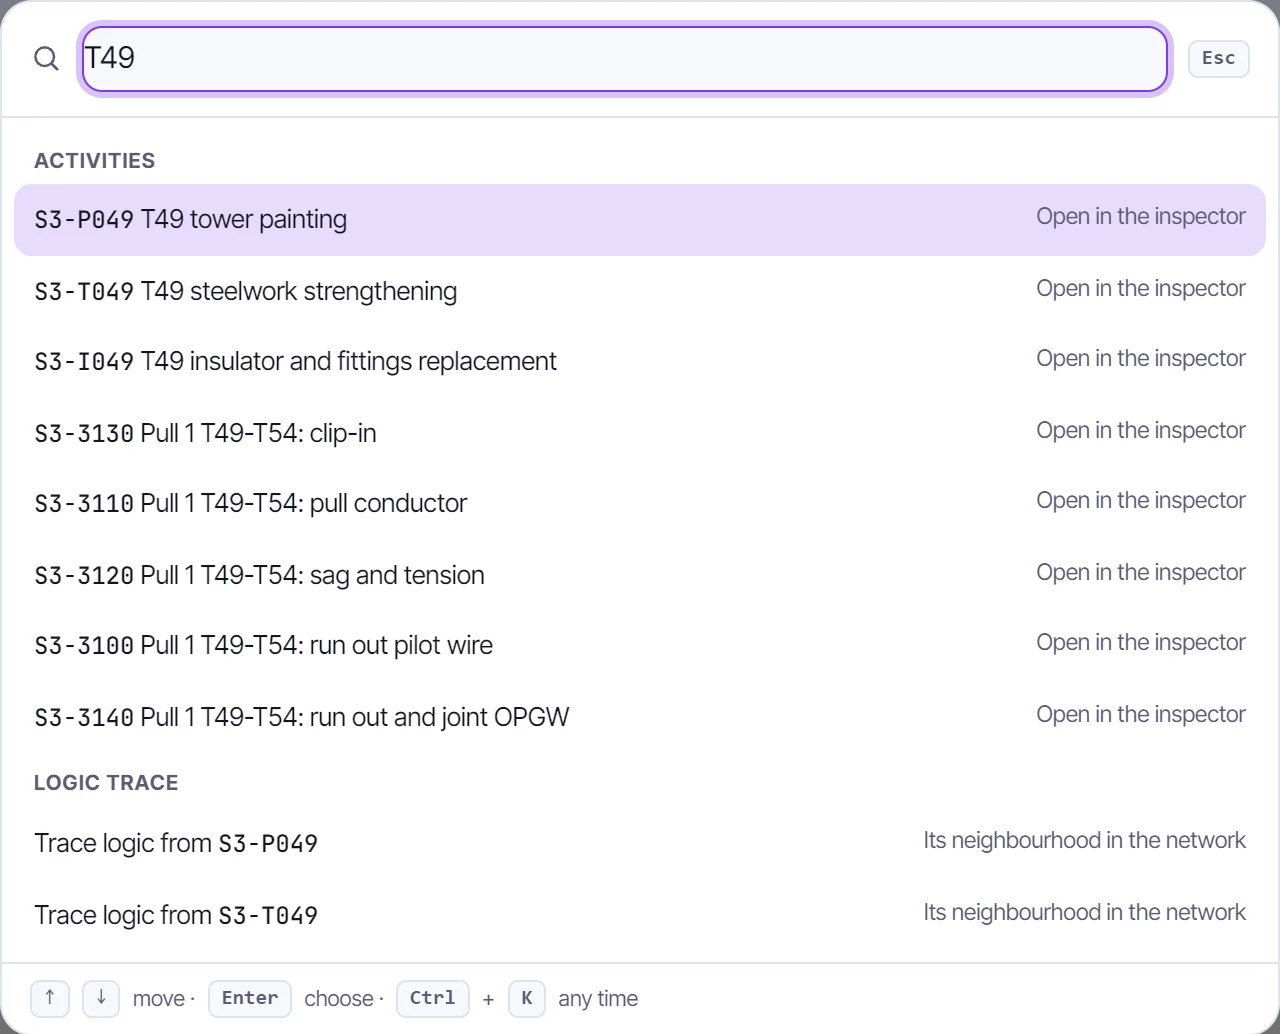
Press Ctrl+K (Cmd+K on a Mac) anywhere to find an activity, a WBS element, an activity code value, an early warning, instruction or compensation event, a contractor, or a command: any tab, export the workbook, clear the filters, print, switch theme. Picking an activity opens the inspector; a WBS element or code value sets the global filter.