Analysis
Time-chainage
Location against time for linear works: mapping, windows and clashes.
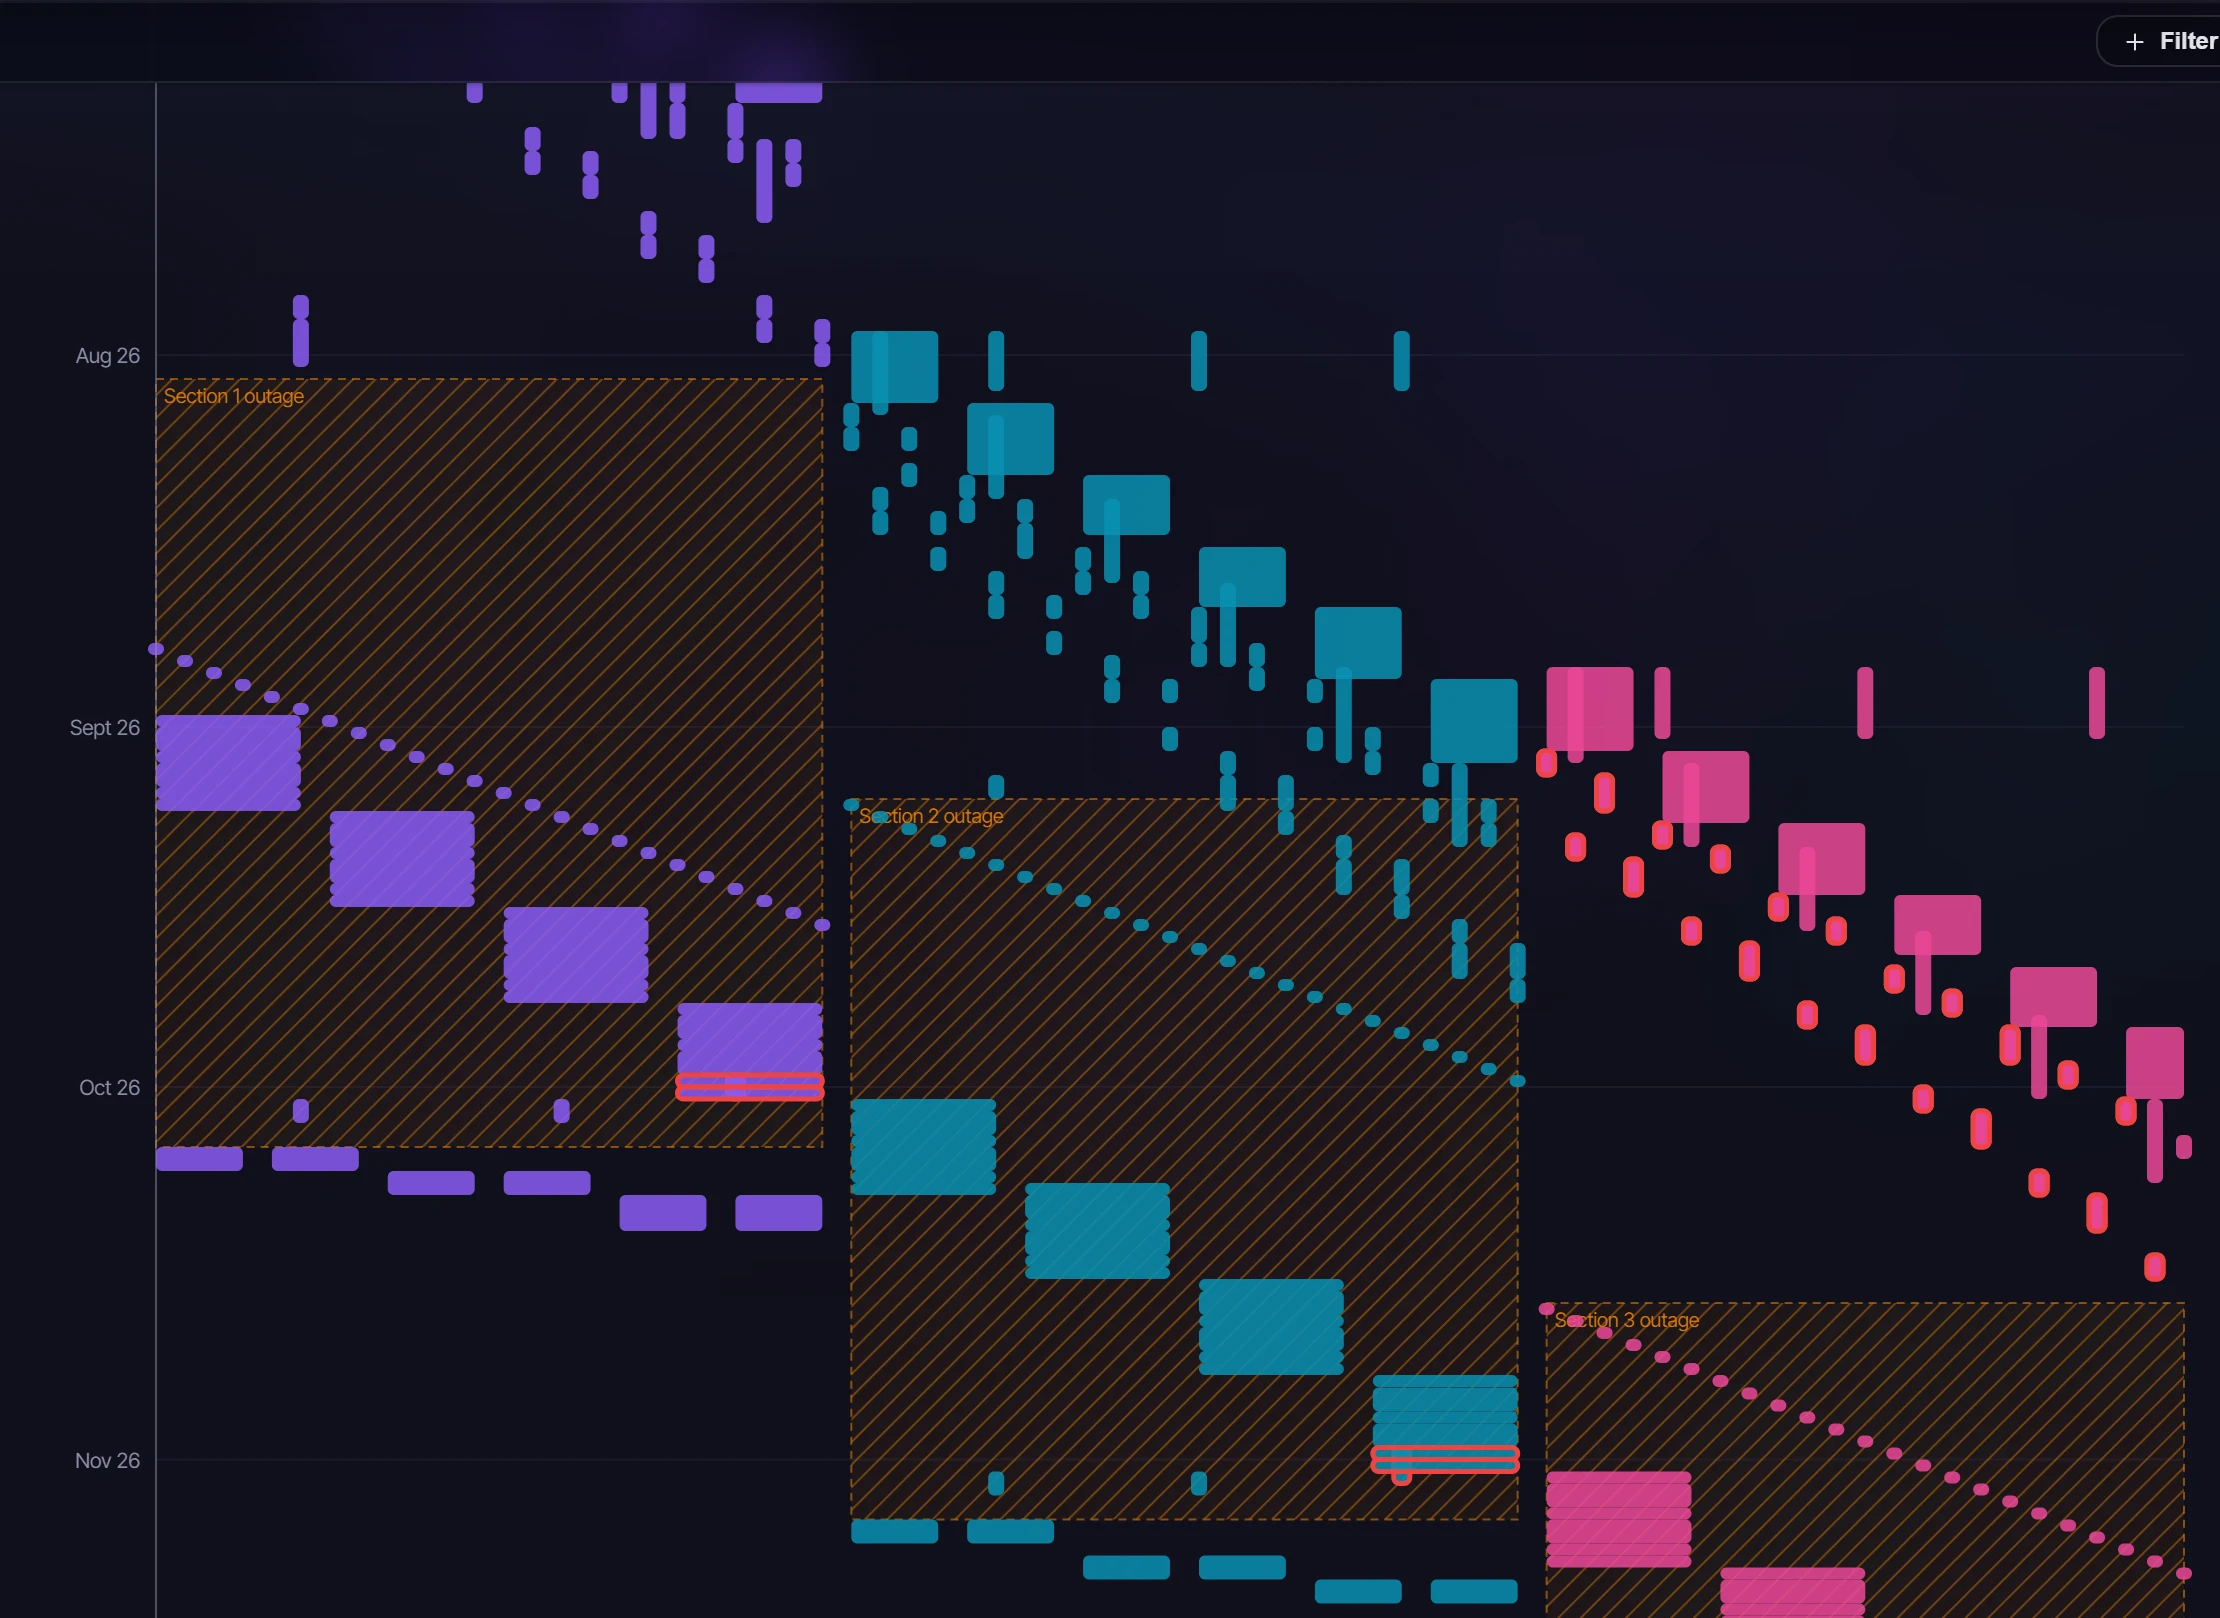
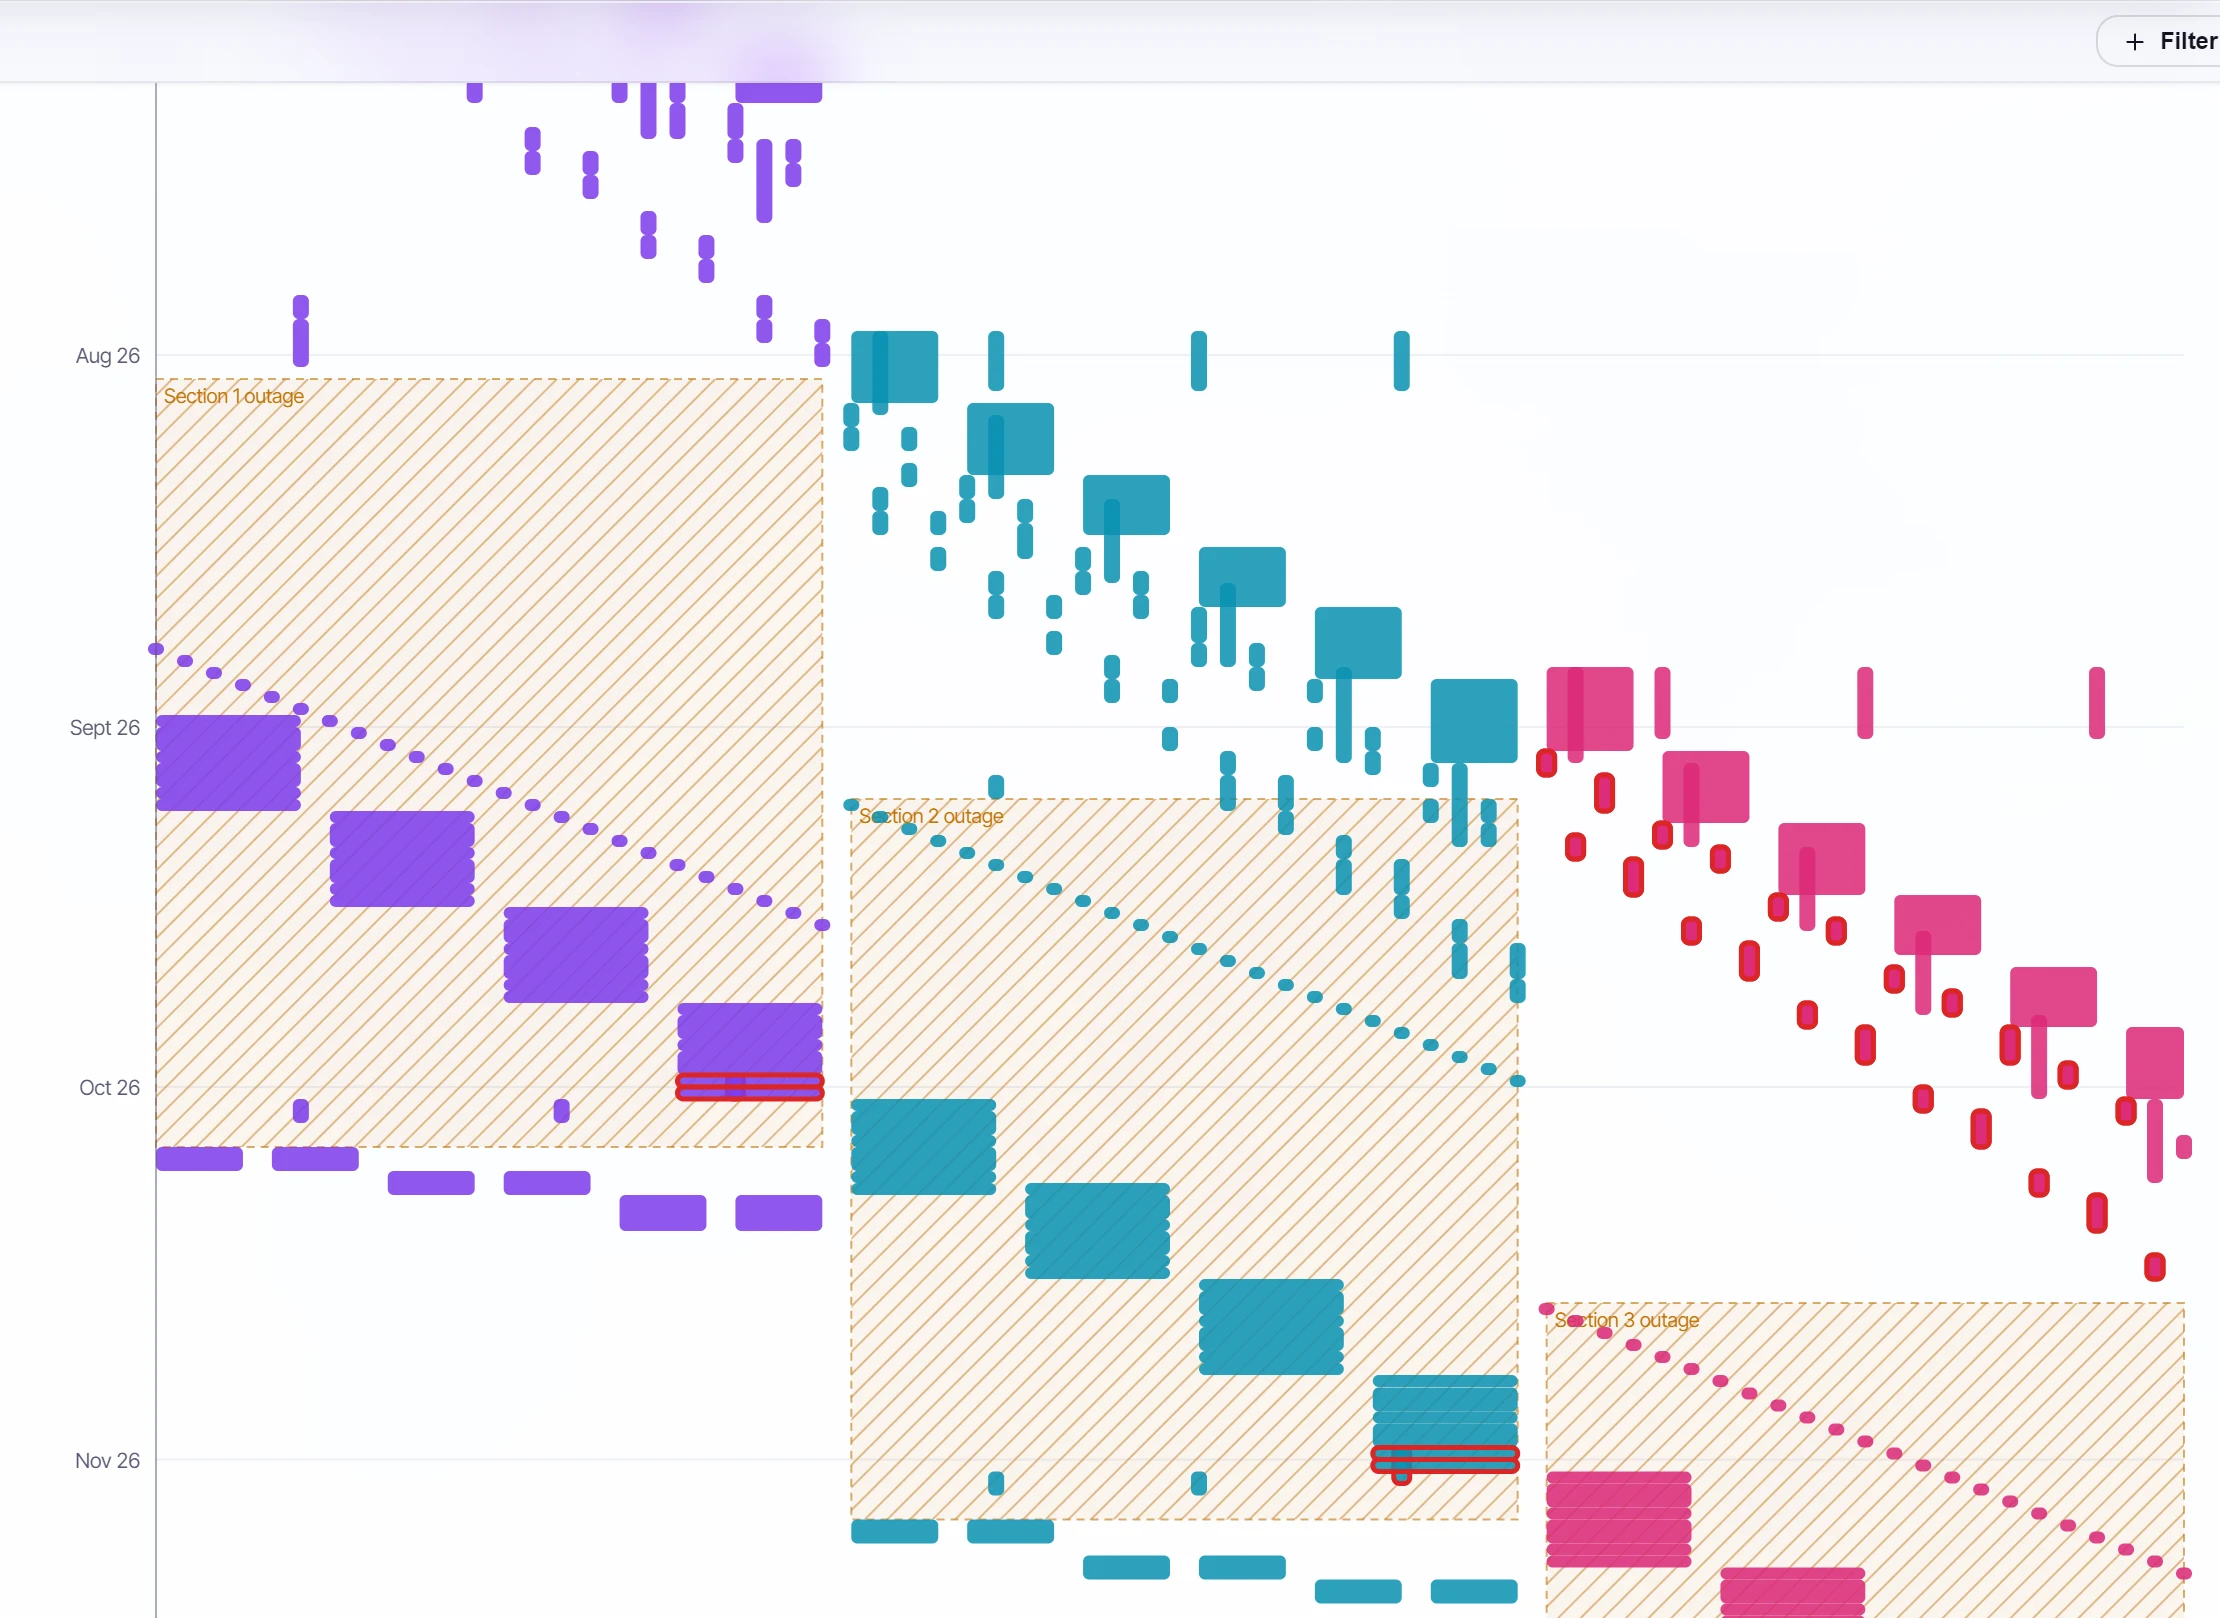
A time-location chart for linear works such as overhead lines, cable routes and rail. Location runs across and time runs down, so a crew moving along the route reads as a line and a stationary task as a block. It's included in Team and Enterprise plans.
Placing activities#
Each activity is placed by the project's location mapping, saved with the project. Map in one of three ways:
| Mapping | How it reads a location |
|---|---|
| An activity code | A tower or a section code: its values in the order you set, else in natural order (T2 before T10), each value one step |
| Chainage UDFs | Start and end chainage user defined fields, in the units they hold |
| A pattern in the name | One captured number is a point, two are a start and an end. A number written km+m ("12+350") reads as 12,350 |
The demo maps its overhead line by the tower numbers in its activity names: "T12" is a point, "Pull 1 T49–T54" a range. Activities with no location are counted and said so, not drawn.
Windows and clashes#
- Windows (outages, possessions) are hatched bands. They come from every activity carrying a chosen code value, or are entered with dates and a location range.
- Clashes: pick a crew code, and two open activities of different crews whose locations and dates both overlap are outlined in red and listed with where and when. Ranges that only meet end to end don't clash, and finished work can't.
Colour by status or by an activity code's values, and draw activities as blocks or as lines. The chart has a data-date line, follows the global filter, and saves as a PNG. Click an activity to open it in the inspector. Only planners and administrators change the mapping.