Analysis
Dashboard and filters
The headline, the update scrubber, the programme visuals and the global filter.
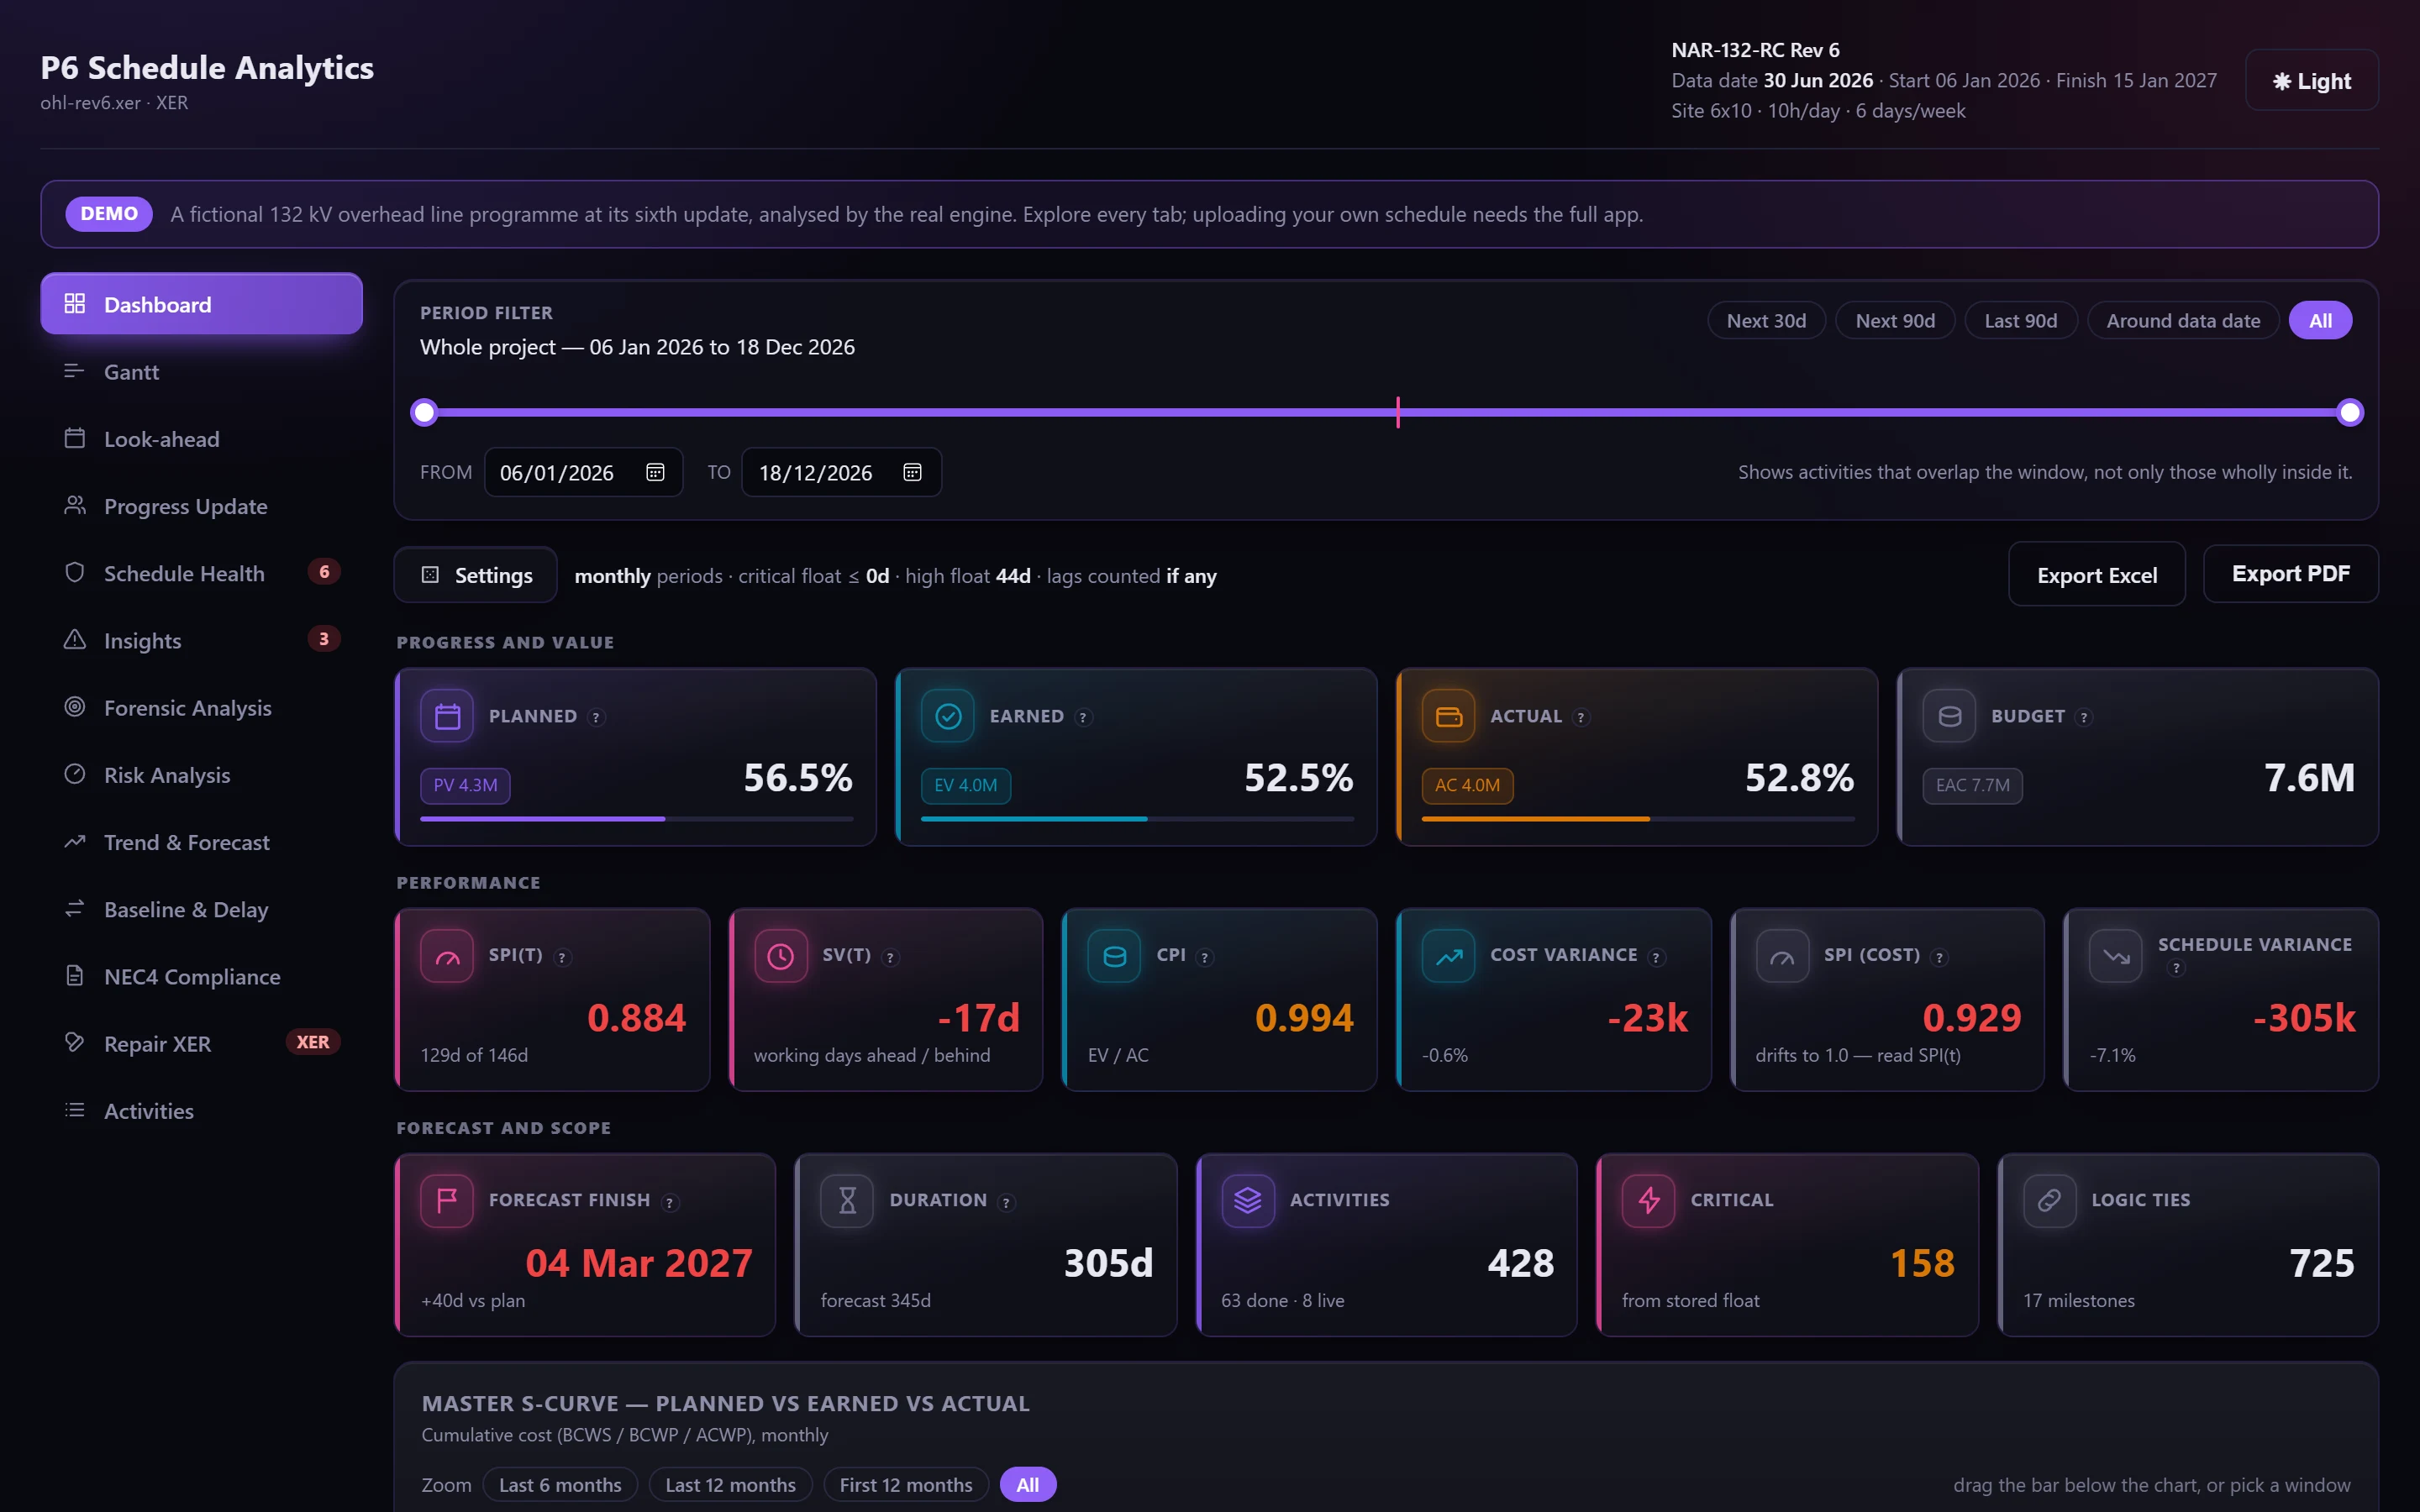
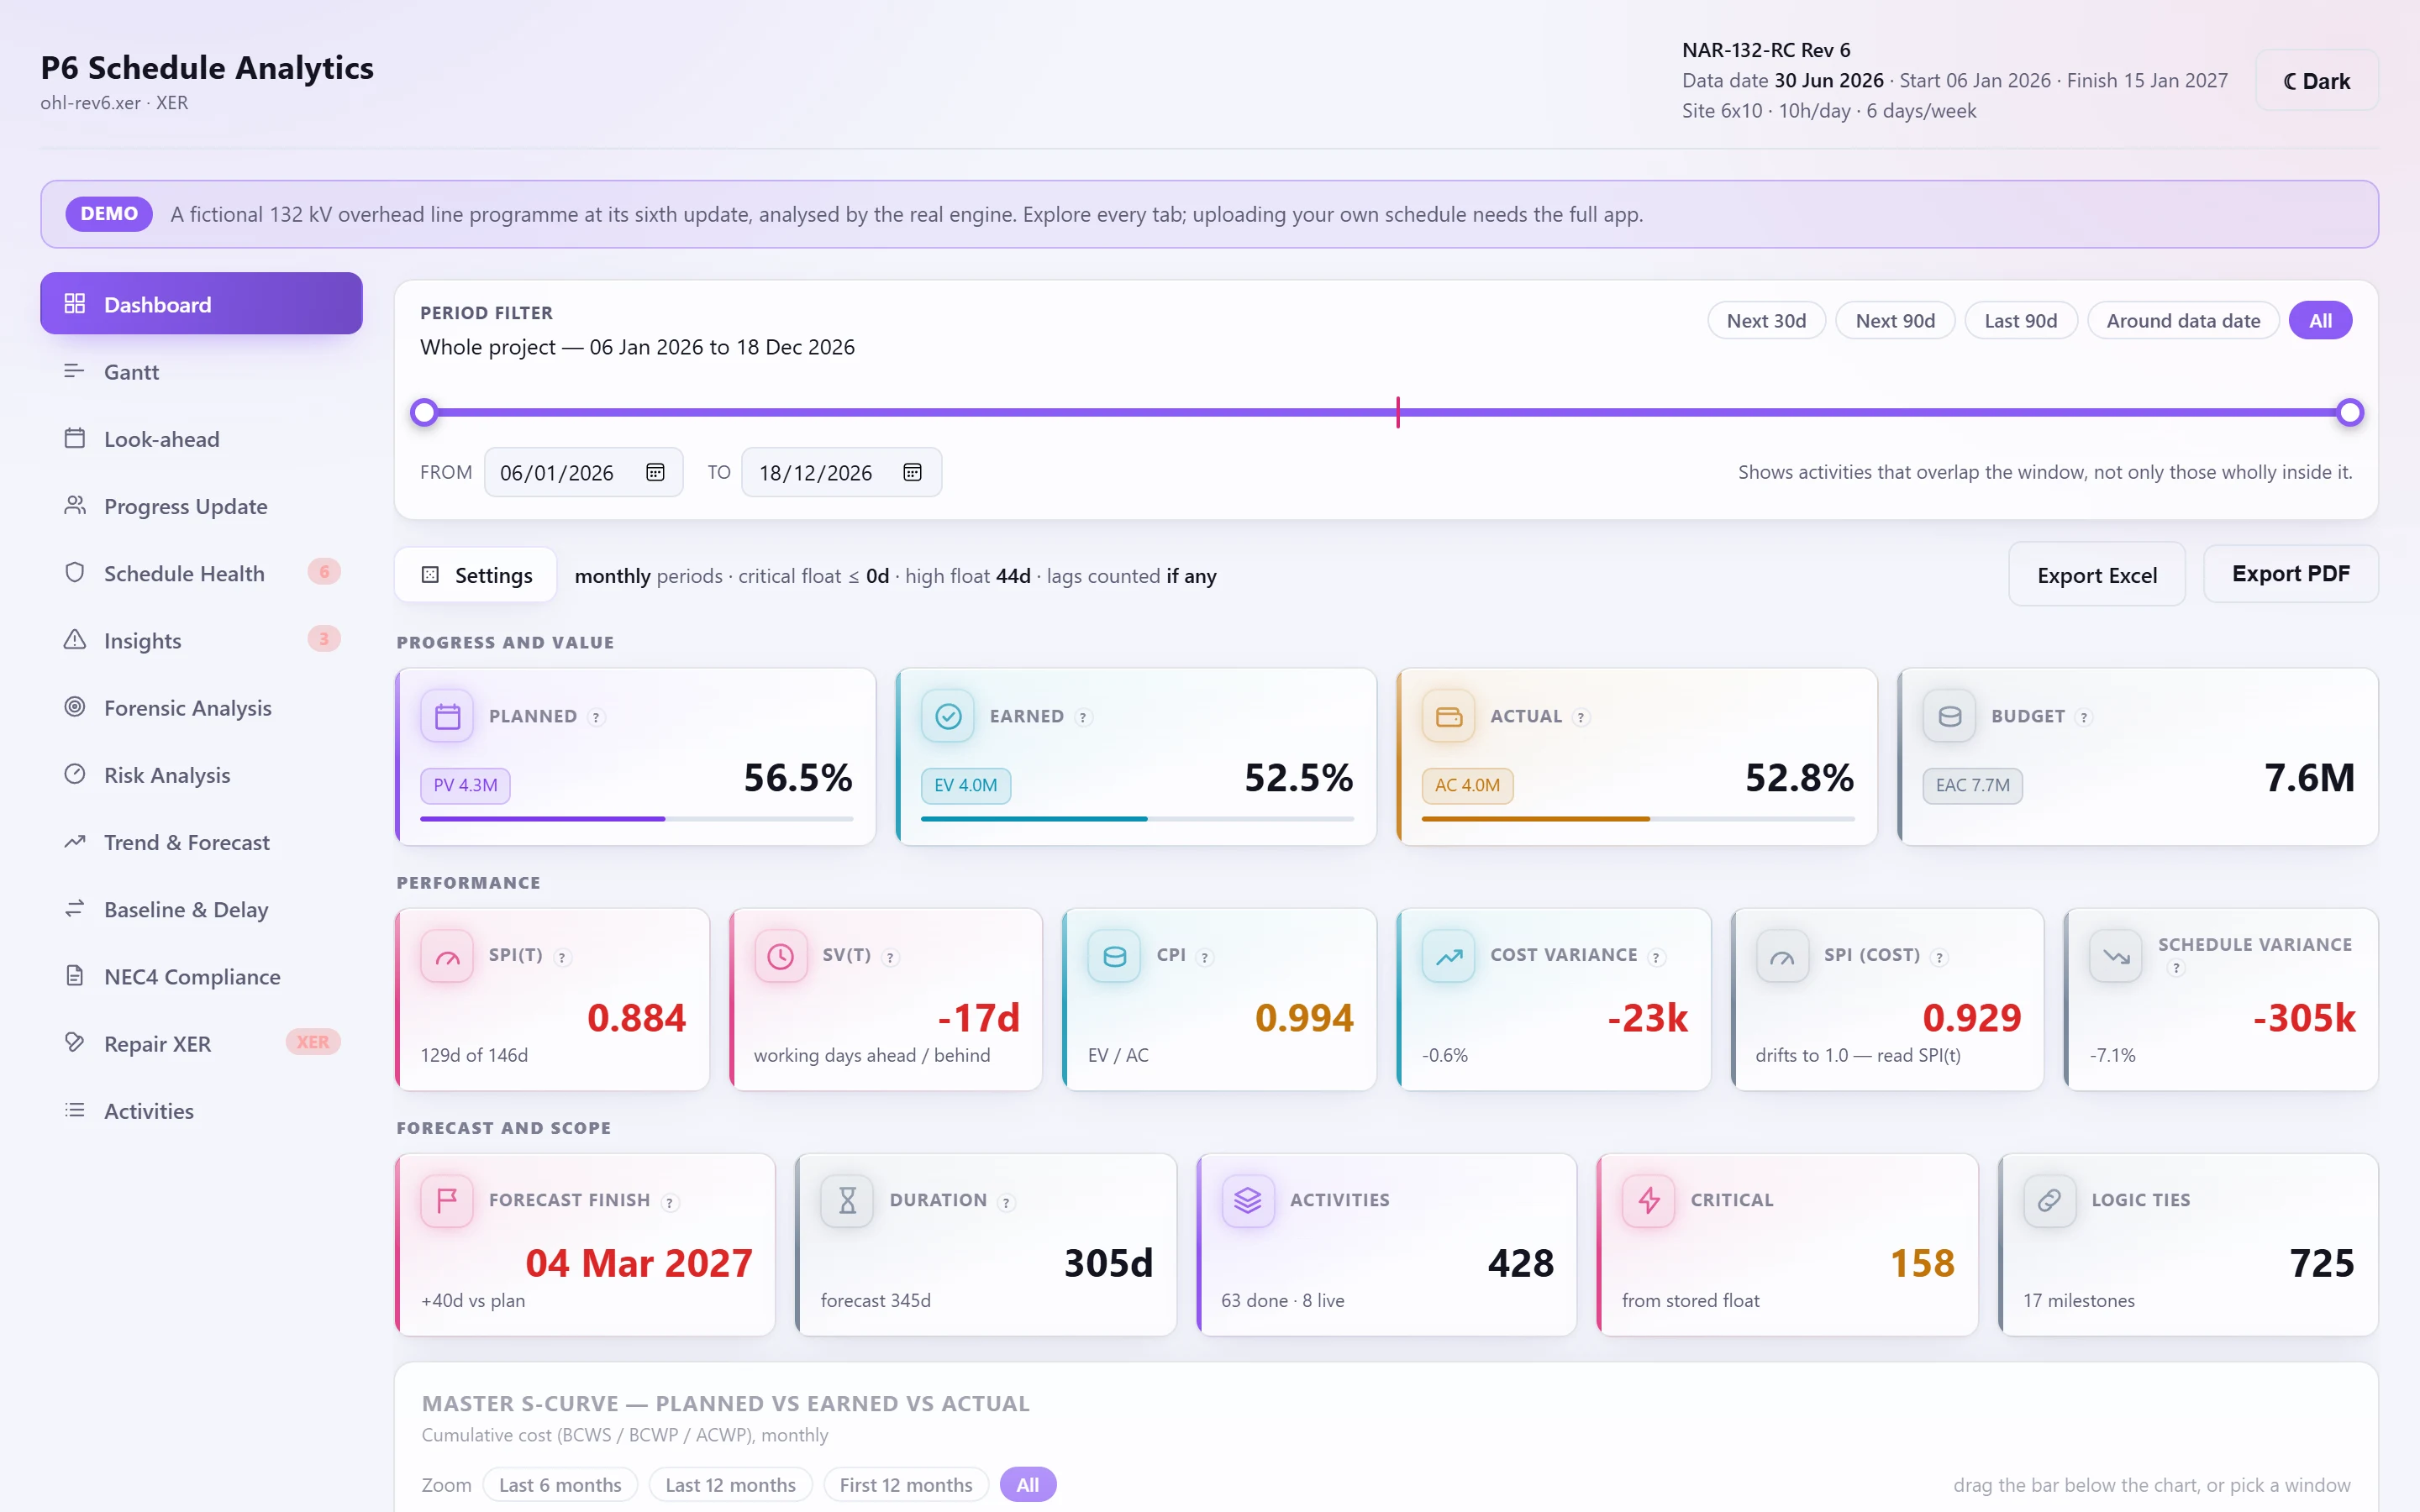
The dashboard is the first thing you see after an upload: the programme's progress, value, performance and forecast on one page.
The headline#
Four cards lead the page:
- Schedule health: a ring with the DCMA score; it opens Schedule Health.
- Forecast finish: the Earned Schedule forecast against the planned finish, with the P50 and P80 dates from the last risk analysis run.
- SPI(t): a gauge, with SPI and CPI.
- Work done: percent complete by duration, activities completed, and BEI against the session's baseline.
Below them:
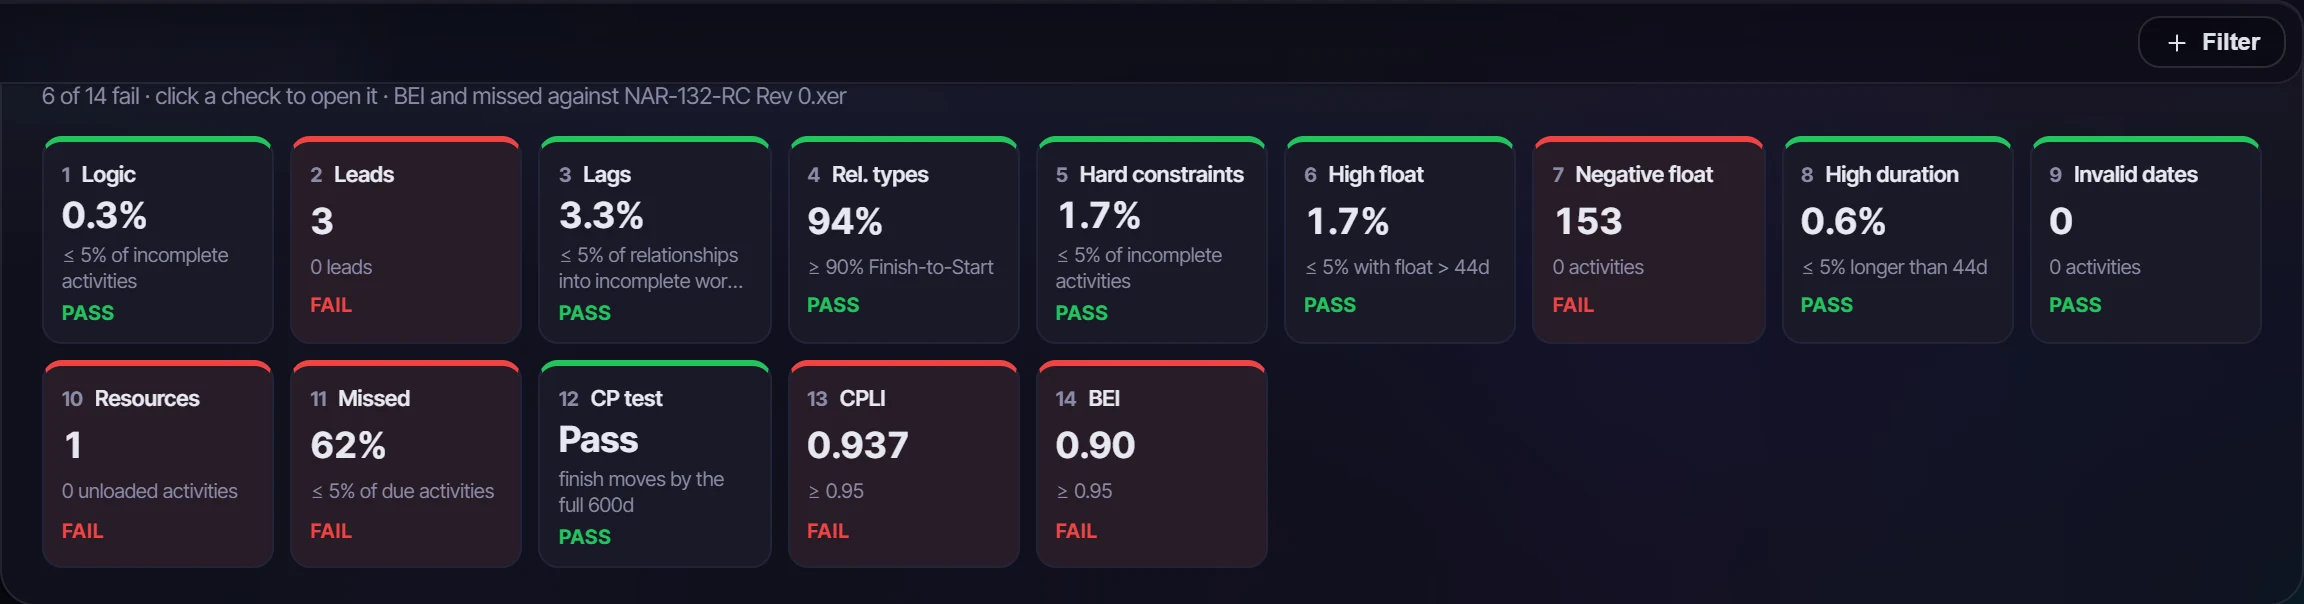
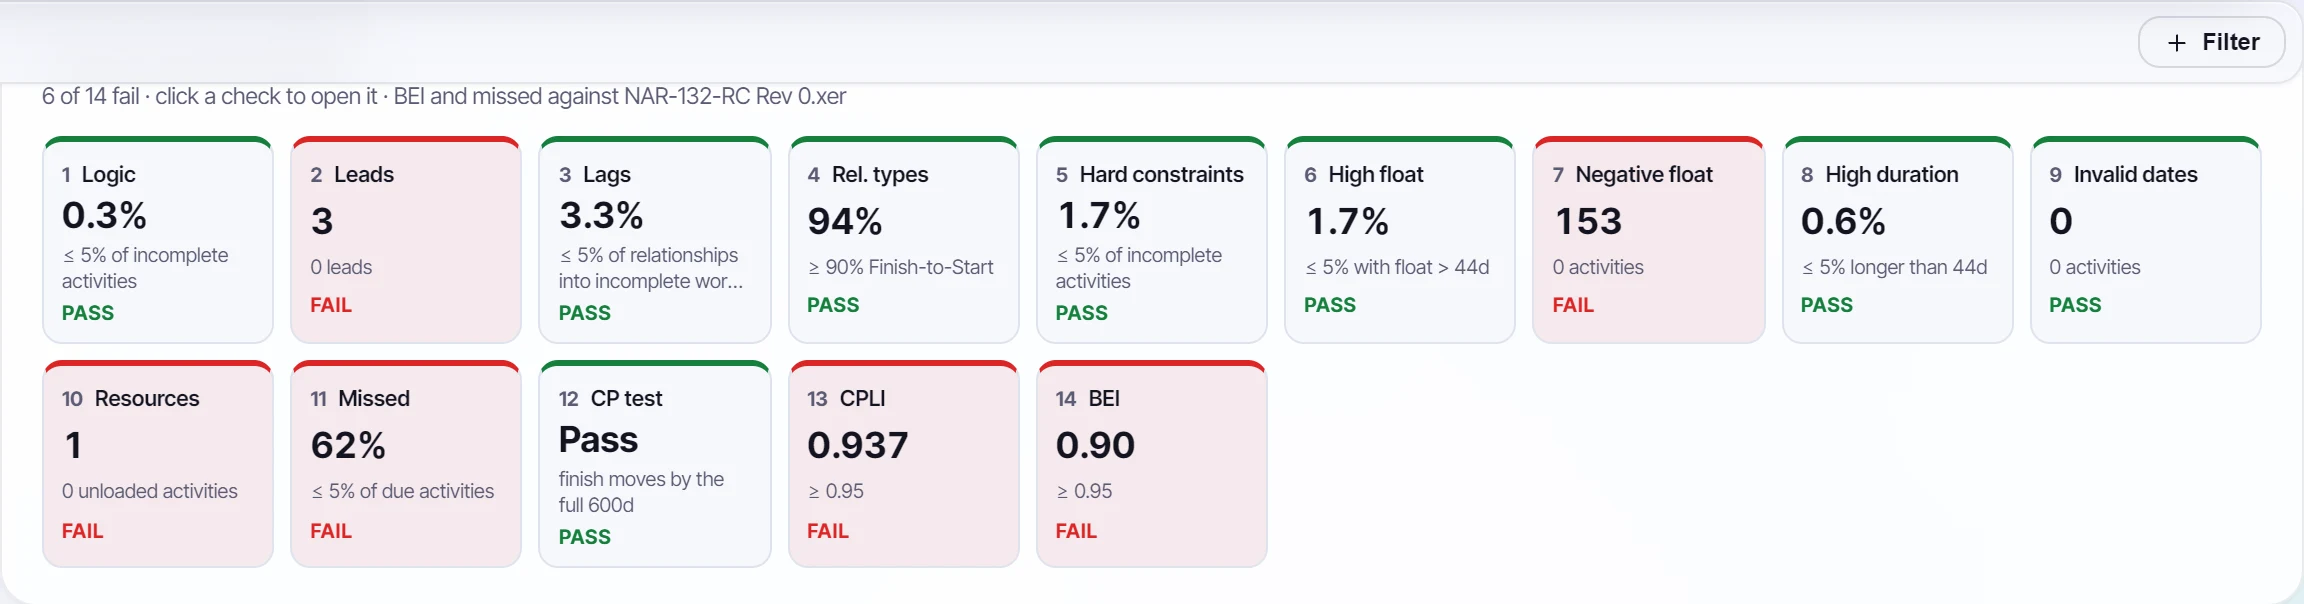
- The DCMA strip: one tile per check, with its figure, target and pass or fail. Click a failing check to filter every tab to the activities it names; click it again to clear the filter.
- The KPI row: each progress and performance figure, with its change since the update before (with an earlier update loaded). A figure that can't be worked out is said in words, never shown as a misleading zero.
- Key milestones: NEC4 Key Dates and Completion when the contract is set up, else the finish milestones, each against the baseline, the contract date or P6's planned finish, with the slip in working days on its own calendar.
See Earned value and earned schedule for what each figure means.
The update scrubber#
With more than one update loaded, the scrubber above the headline has a stop for each, in data-date order. A stop shows the Dashboard as it stood at that update (the headline, the DCMA strip, the KPI row, the charts and the driving path), each update measured against the one before it. The driving path marks the activities that joined it since. Step through with ‹ ›, or press ▶ to play from the oldest to the newest.
The charts#
- Master S-curve: planned, earned and actual value, cumulative, by day, week or month. Zoom to the last 6 or 12 months, the first 12, or drag the bar under the chart.
- Total float distribution: open activities in float bands from below zero to over 40 days. Where the critical path was recomputed, stored and recomputed float can be shown side by side.
- Status mix and critical vs non-critical work.
- Resources: demand over time stacked by resource type or by resource, demand share, planned against actual totals, and over-allocation where a resource has a maximum.
- Driving path: the activities on the recomputed path to completion, as a list or a timeline against the data date.
- Float erosion: open activities at each loaded update, stacked into critical, near-critical and high float.
Visuals of the whole programme#
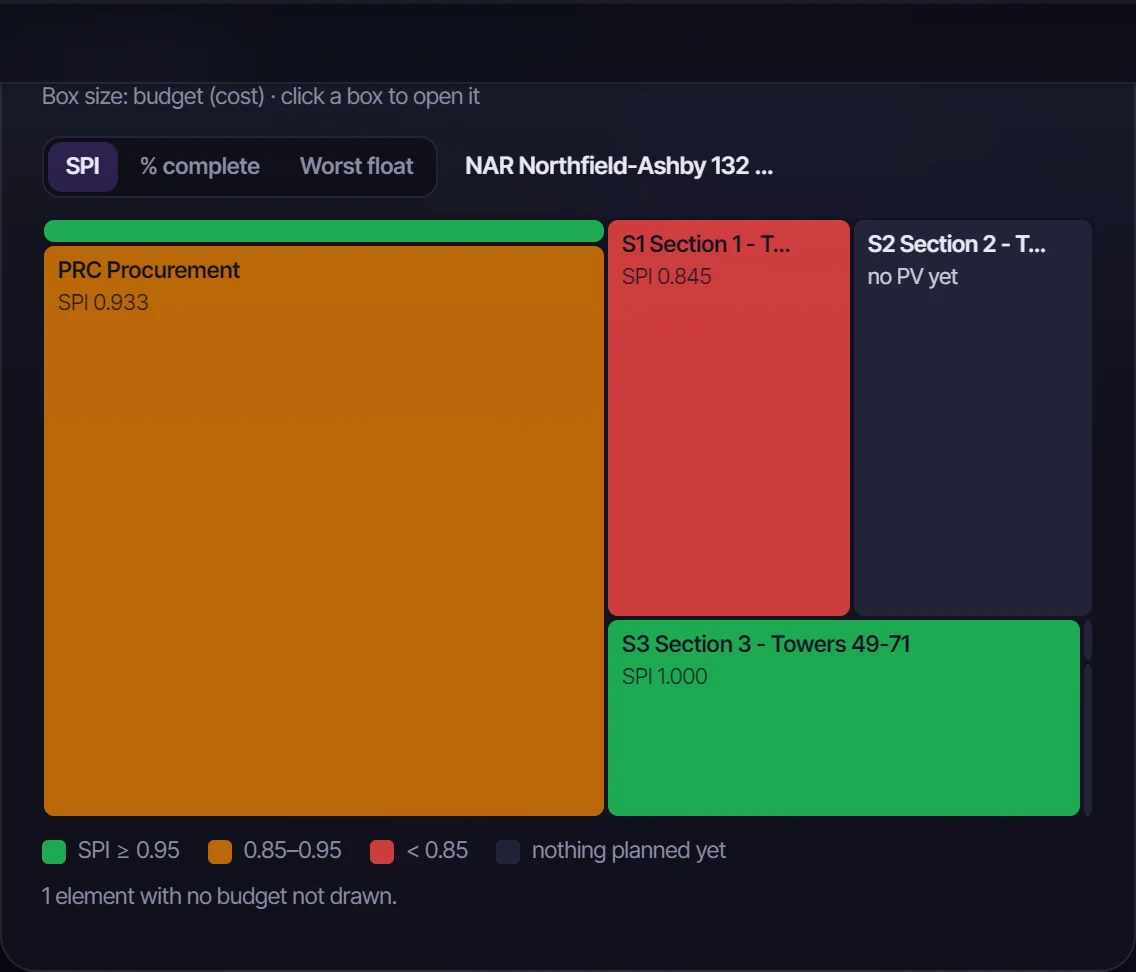
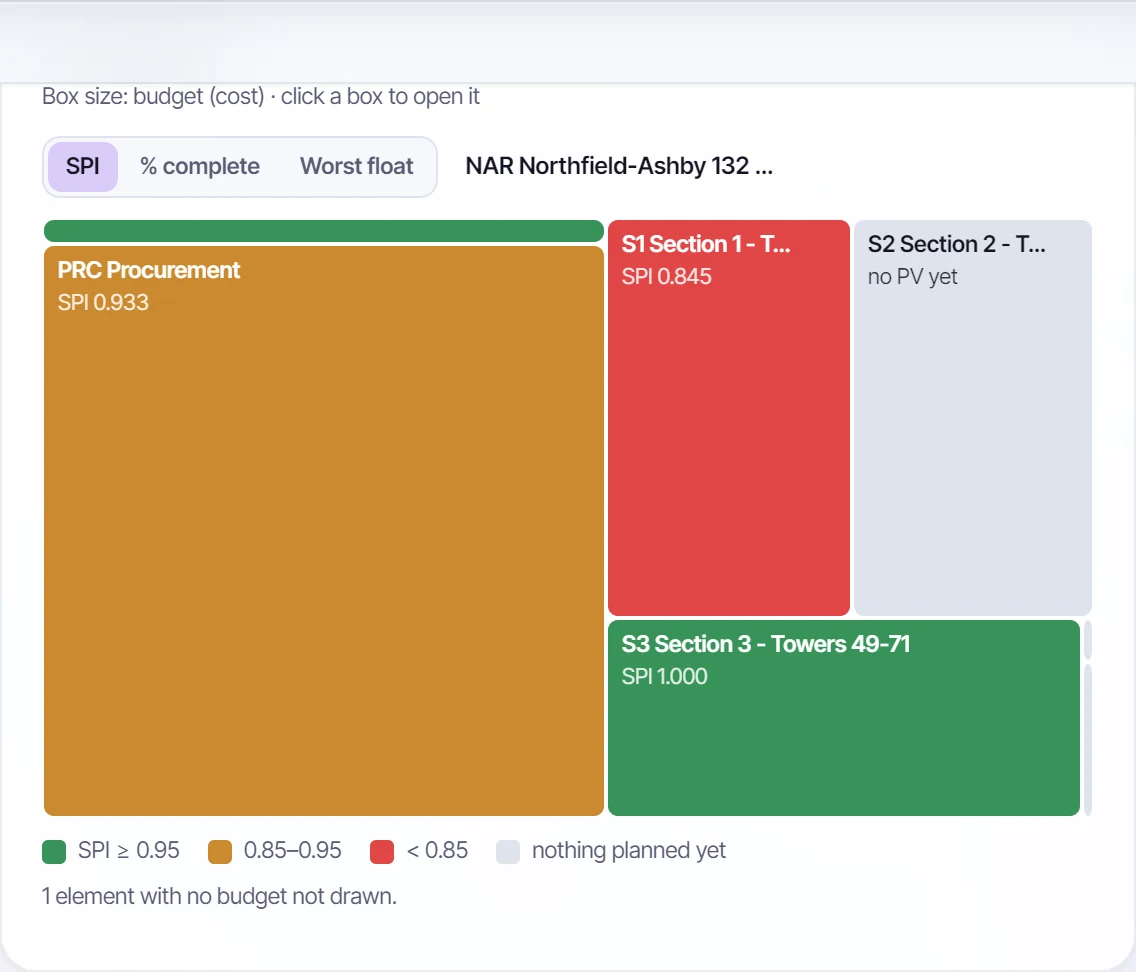
- WBS treemap: each box a WBS element, sized by budget (or remaining duration with no budget) and coloured by SPI, % complete or worst float. Click a box to filter every tab to it; the treemap then shows what's beneath it.
- Insights by WBS: the WBS down, every finding across, each cell counting the activities it names. Click a cell to filter to both.
- Workfront density: weeks across, WBS elements or resources down, showing the live work in each week or the planned units. An orange dot marks an out-of-sequence start; a red outline, a week in which a resource's demand is over its limit.
Every chart can be saved as a PNG from its corner.
The period filter#
The filter above the dashboard narrows it to a date window: the next 30 or 90 days, the last 90, around the data date, or dates you choose. It keeps activities that overlap the window, not only those wholly inside it, and uses the dates P6 shows now: actual, else forecast, else planned. So live work is never dropped from a period it's still running in.
The global filter#
One filter for the whole programme, read by the Dashboard, Activities, the Gantt and the Look-ahead at once. Add conditions with + Filter, each listing the programme's own values with how many activities carry them; they combine with AND, and show as chips under the top bar.
| Condition | Keeps |
|---|---|
| WBS element | The element and everything beneath it, as P6 filters a WBS |
| Activity code | Activities with one value of a code type |
| Status | Not started, in progress or completed |
| Float band | Negative, critical, near-critical (up to 5 days above critical) or high float, on the float P6 stored, in working days |
| Resource | Activities with an assignment to it |
| Insight | Every activity a finding names |
| Failing DCMA check | The activities a failing check names |
You can also set it from the page: a slice of the status donut, a bar of resource totals, a finding, a WBS or status cell in Activities, or the treemap. The Dashboard is recalculated over the matching activities; the Look-ahead lists only matching work but still reads what each is waiting on from the whole programme. The filter is remembered for each programme. Filtering to a period is free on every plan; the other conditions are part of Professional.
Analysis settings#
The settings strip sets:
| Setting | Default | Used by |
|---|---|---|
| Period | Monthly | S-curves and histograms |
| Critical float | 0 days | What counts as critical |
| High float | 44 days | DCMA check 6 |
| High duration | 44 days | DCMA check 8 |
| Lag threshold | 0 (any positive lag) | DCMA check 3 |
An administrator sets the defaults for everyone under Administration → Analysis defaults.
Diagnostics#
Findings about the data itself appear above everything else, because they change how the rest should be read:
- the file wasn't rescheduled against its data date;
- all stored float is negative, so the critical path was recomputed from the logic;
- cost was taken from resource assignments because the activity cost fields were empty;
- the file carries no cost, so curves are in resource units;
- activities without late dates, left out of float-based checks.