Analysis
Earned value and earned schedule
Every metric, the Earned Value tab worked out as P6 does, and a worked example.
Earned value measures progress in money (or resource units), against the plan. Earned Schedule measures it in time. The app calculates both from the programme itself: the budget on each activity, its percent complete and its planned dates.
Where the numbers come from#
- Budget: resource assignment cost where the assignments carry it, otherwise activity cost. Many exports leave the activity cost fields at zero even when the programme is fully cost-loaded; the dashboard says which basis it used.
- No cost at all? Everything is calculated in resource units instead, and labelled as such.
- Planned value is spread across each activity's planned dates, working day by working day on its own calendar. When the export doesn't carry a separate baseline, P6's planned dates are the baseline.
- Percent complete: the activity's nominated percent-complete type, falling back to physical, units and then duration percent where the nominated one is empty.
The metrics#
| Metric | Formula | Read it as |
|---|---|---|
| BAC | Σ budget | What the whole job should cost |
| PV (BCWS) | Budget due by the data date on the planned dates | Work that should have been done |
| EV (BCWP) | Σ budget × % complete | Work that has been done, valued at budget |
| AC (ACWP) | Σ actual cost | What the work done actually cost |
| SV | EV − PV | Behind (negative) or ahead of plan, in money |
| CV | EV − AC | Over (negative) or under budget, in money |
| SPI | EV ÷ PV | Below 1.0: behind plan |
| CPI | EV ÷ AC | Below 1.0: over budget |
| EAC | BAC ÷ CPI | Forecast final cost at today's cost efficiency |
| VAC | BAC − EAC | Forecast over (negative) or under spend |
| TCPI | (BAC − EV) ÷ (BAC − AC) | Efficiency the rest of the job must achieve to hit budget |
Earned Schedule#
Cost-based SPI becomes unreliable late in a project: as work finishes, EV converges on PV and SPI drifts back towards 1.0 however late the job is. Earned Schedule asks when the value earned so far should have been earned, and compares that date with the data date.
| Metric | Formula |
|---|---|
| ES | The point on the planned value curve where today's EV would have been earned |
| AT | Working days from the start to the data date |
| SV(t) | ES − AT, in working days |
| SPI(t) | ES ÷ AT |
| IEAC(t) | Planned duration ÷ SPI(t) |
| Forecast finish | Start + IEAC(t) working days |
A worked example#
The demo programme at 30 Jun 2026:
- BAC is £7,639,485. PV is £4,296,067 and EV is £4,007,739, so SPI = EV ÷ PV = 0.933. Value is being earned at about 93% of the planned rate.
- AC is £4,030,261, so CPI = EV ÷ AC = 0.994: very slightly over budget. EAC = BAC ÷ CPI = £7,682,415.
- The value earned by the data date should have been earned by 10 Jun 2026. That puts ES at 128.9 working days against an AT of 145.9 working days: SV(t) = -17 working days, and SPI(t) = 0.884.
- With a planned duration of 305.8 working days, IEAC(t) = 346.1 working days, a forecast finish of 5 Mar 2027.
The Earned Value tab#
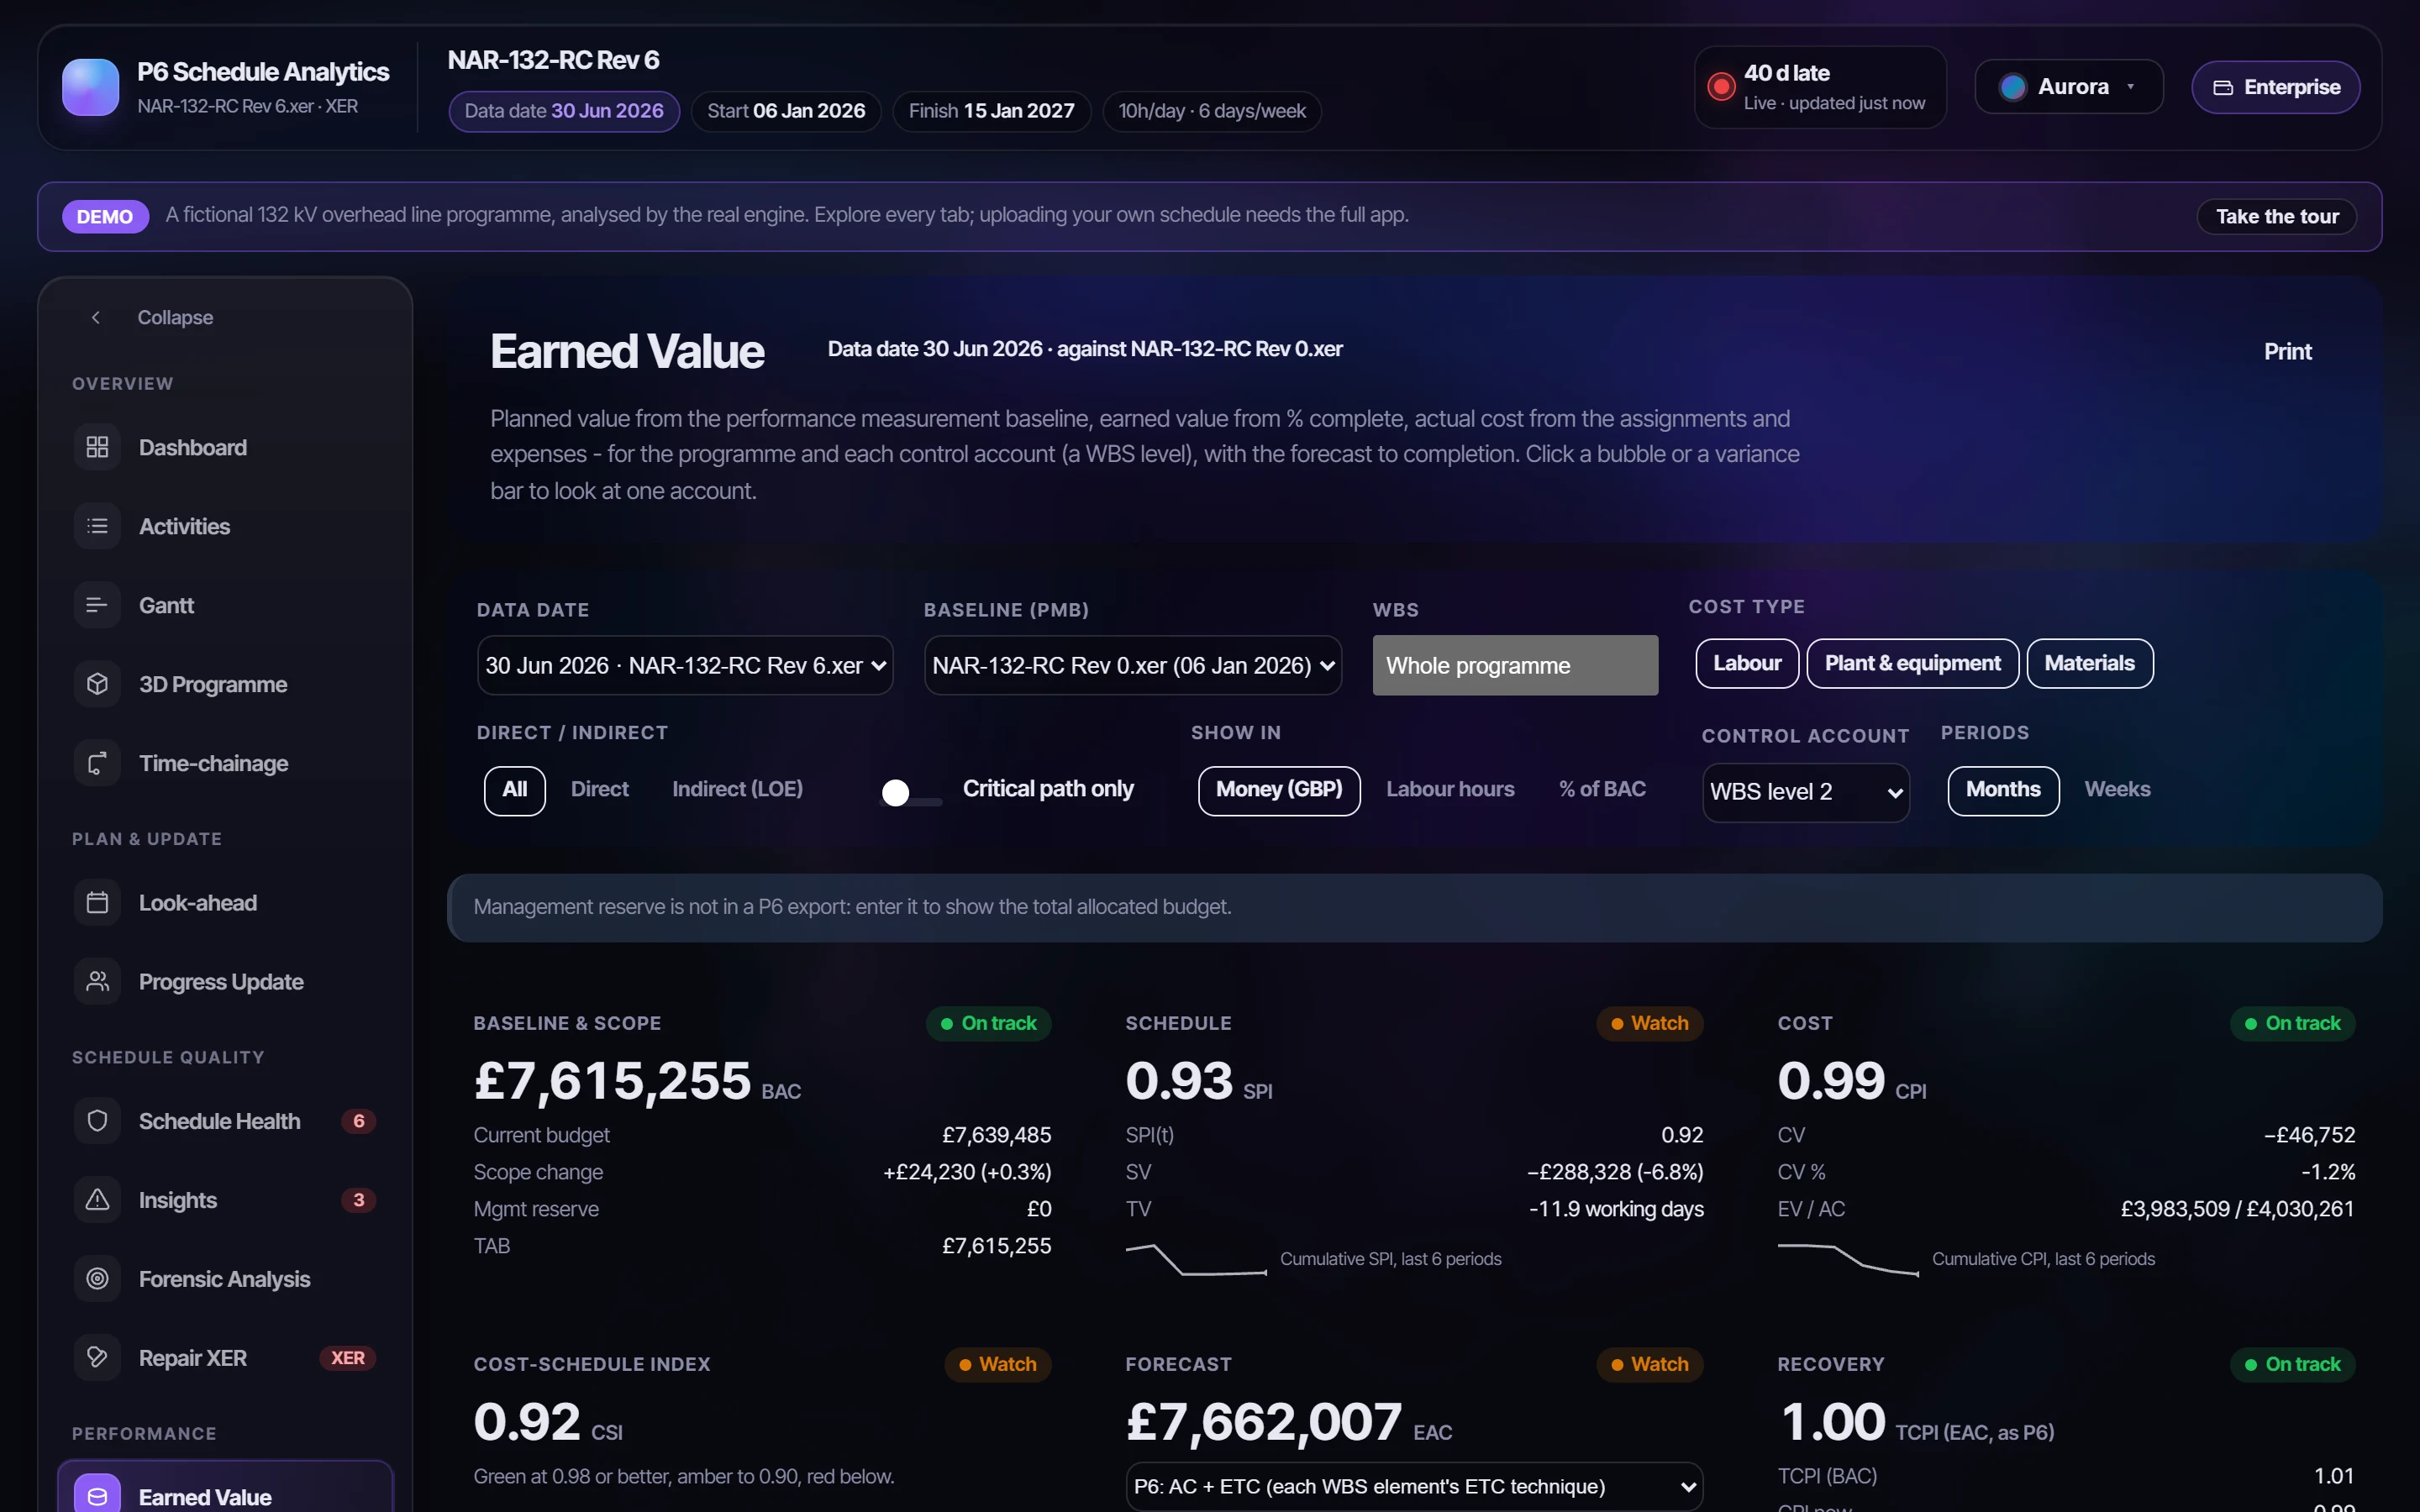
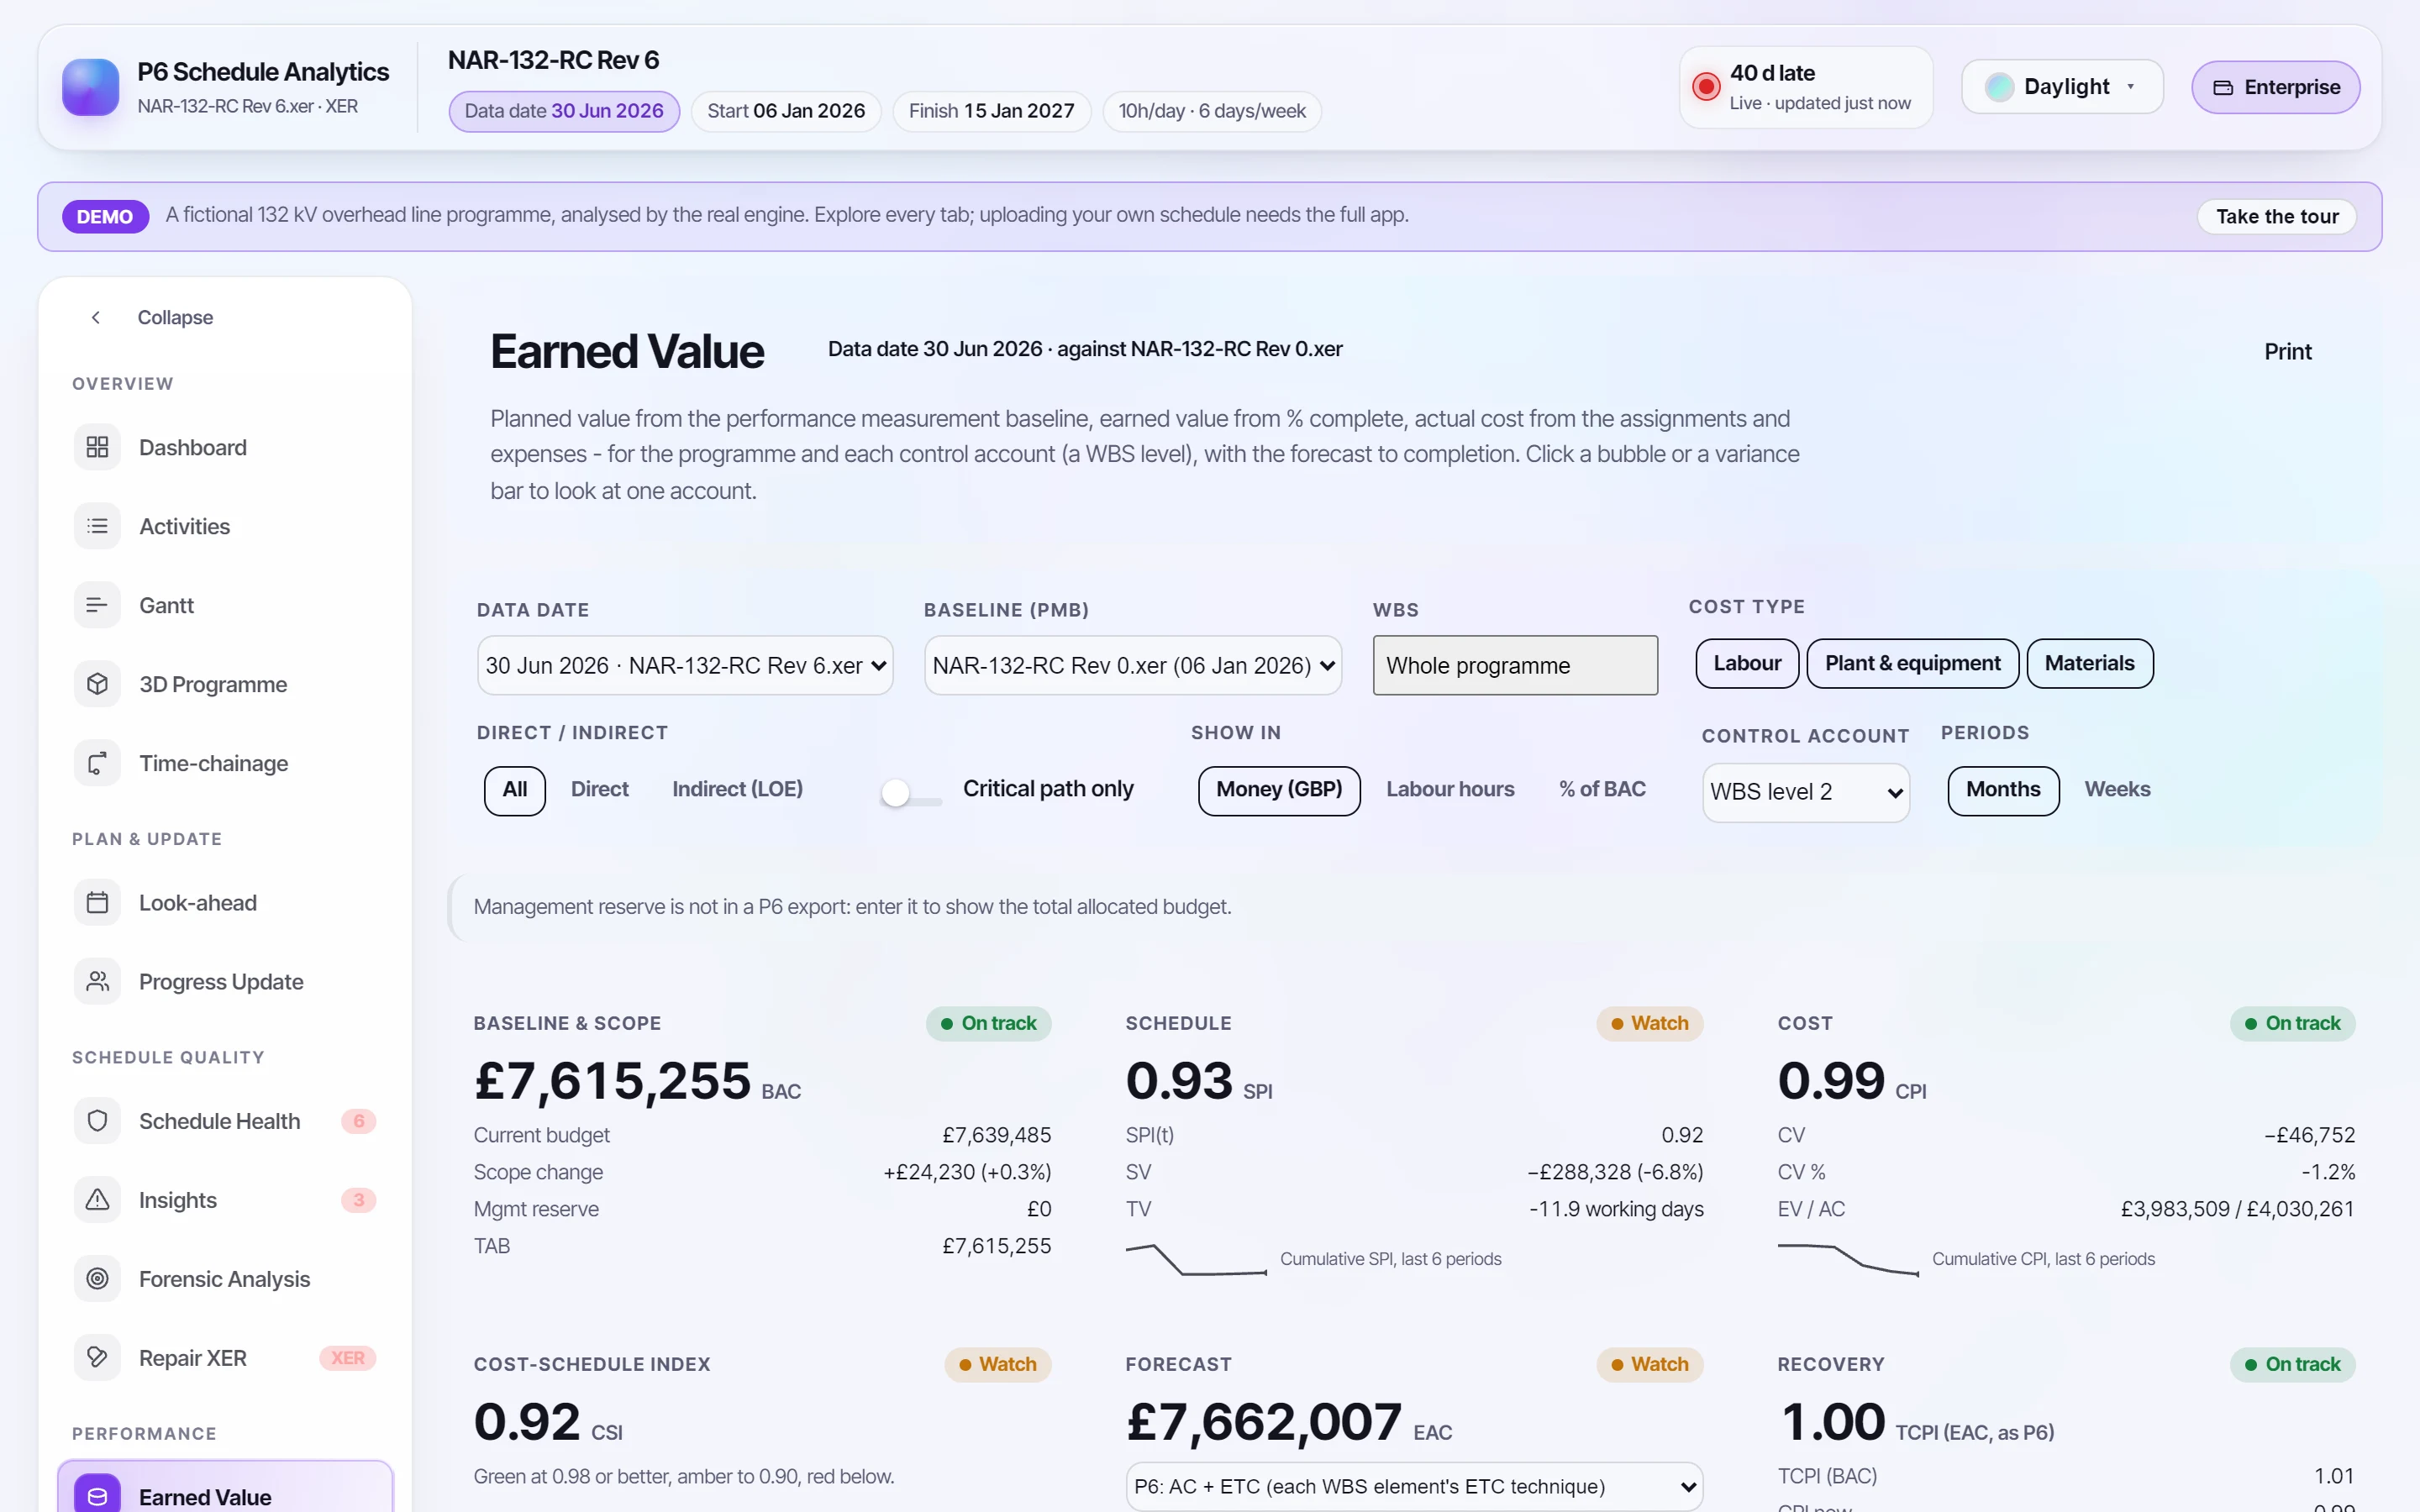
The Dashboard's figures give a quick read. The Earned Value tab reports EVM in full, by control account, worked out the way P6 works it out (P6's default, "budgeted values with planned dates"). Every BAC, PV, EV, AC, ETC, EAC, SV, CV, VAC, SPI, CPI and TCPI of a test project and its WBS elements matched P6's own figures, in each earned value technique.
| Measure | On the Earned Value tab |
|---|---|
| BAC | Each activity's baseline budget: resource assignments and project expenses, in money or labour hours. Work added since the baseline has none, though its actual cost and ETC count |
| PV | BAC spread over the baseline's planned dates to the data date. Without a baseline, P6's planned dates are used and the page says SPI and SV understate slippage |
| EV | BAC × the performance % complete, by the technique the activity's WBS element sets in P6: activity % complete, 0/100, 50/50 or a custom % |
| ETC | P6's remaining cost, or (BAC − EV) × a performance factor (1, a set value, 1/CPI or 1/(CPI × SPI)), by the WBS element's technique |
| EAC | AC + ETC, as P6 works it, unless you choose BAC ÷ CPI or CPI × SPI |
| TCPI | Towards EAC, as P6 shows it: (BAC − EV) ÷ (EAC − AC). Towards BAC beside it |
| Currency | The currency you view in, at the file's own exchange rates, as P6 shows it |
The page: choose the update reported, the baseline, WBS branches, the cost type, direct or indirect work, money, labour hours or % of BAC, and the control-account level. Six cards (scope, SPI with SPI(t), CPI, CSI, EAC and TCPI) each carry a status in words and a six-period trend. Below them: the S-curve with the forecast to EAC; CPI against SPI by control account; the period's planned, earned and spent; the bridge from BAC to EAC; variance by control account, worst first; and whether the budget can still be met. Click a control account anywhere and the page narrows to it.
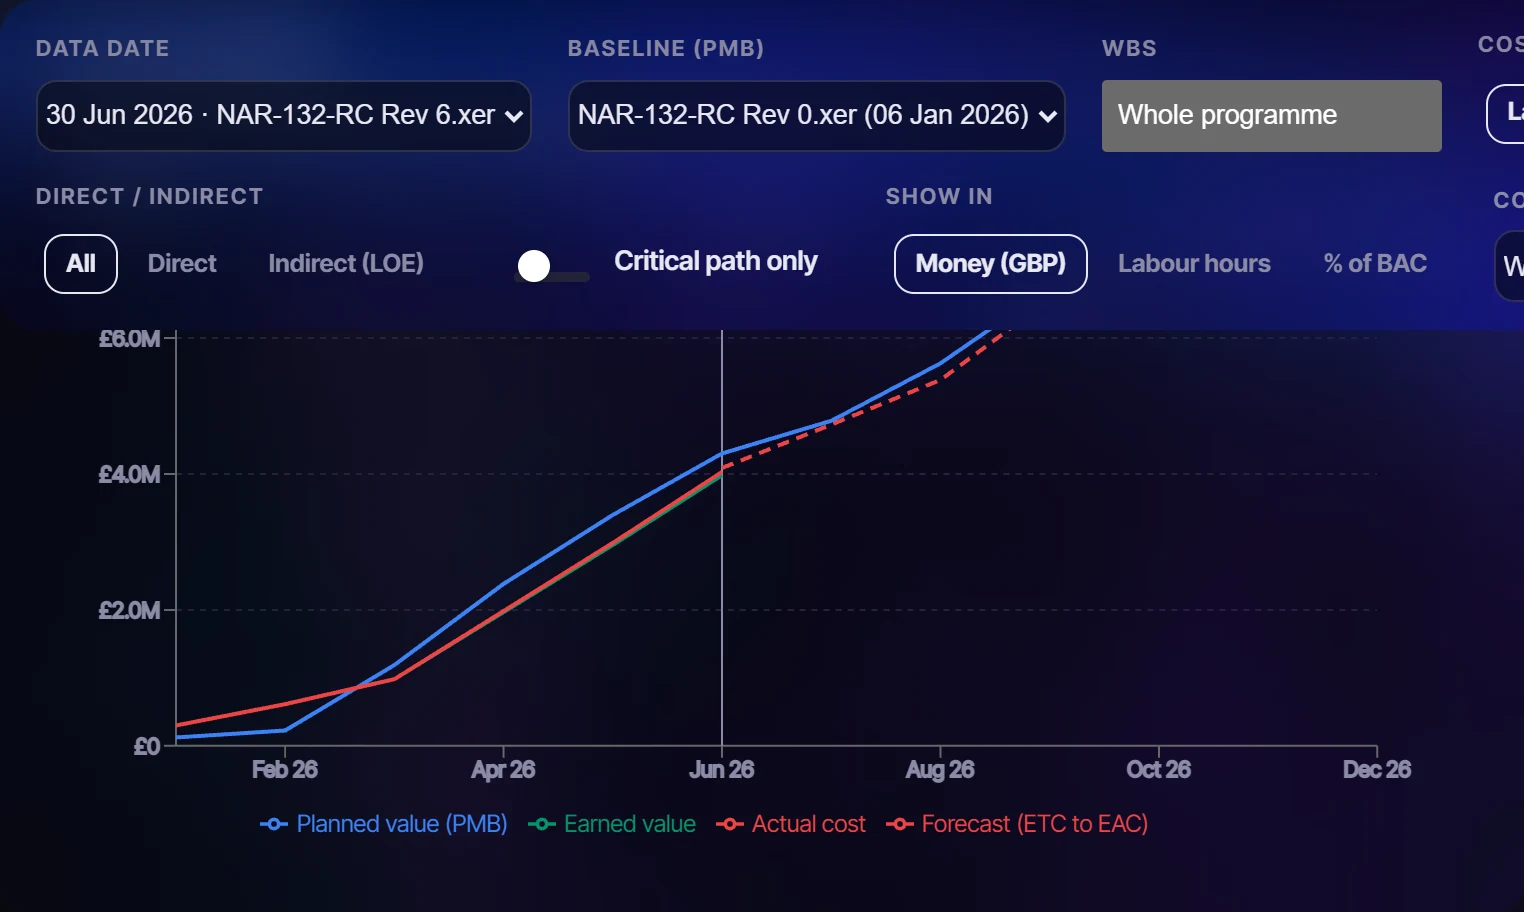
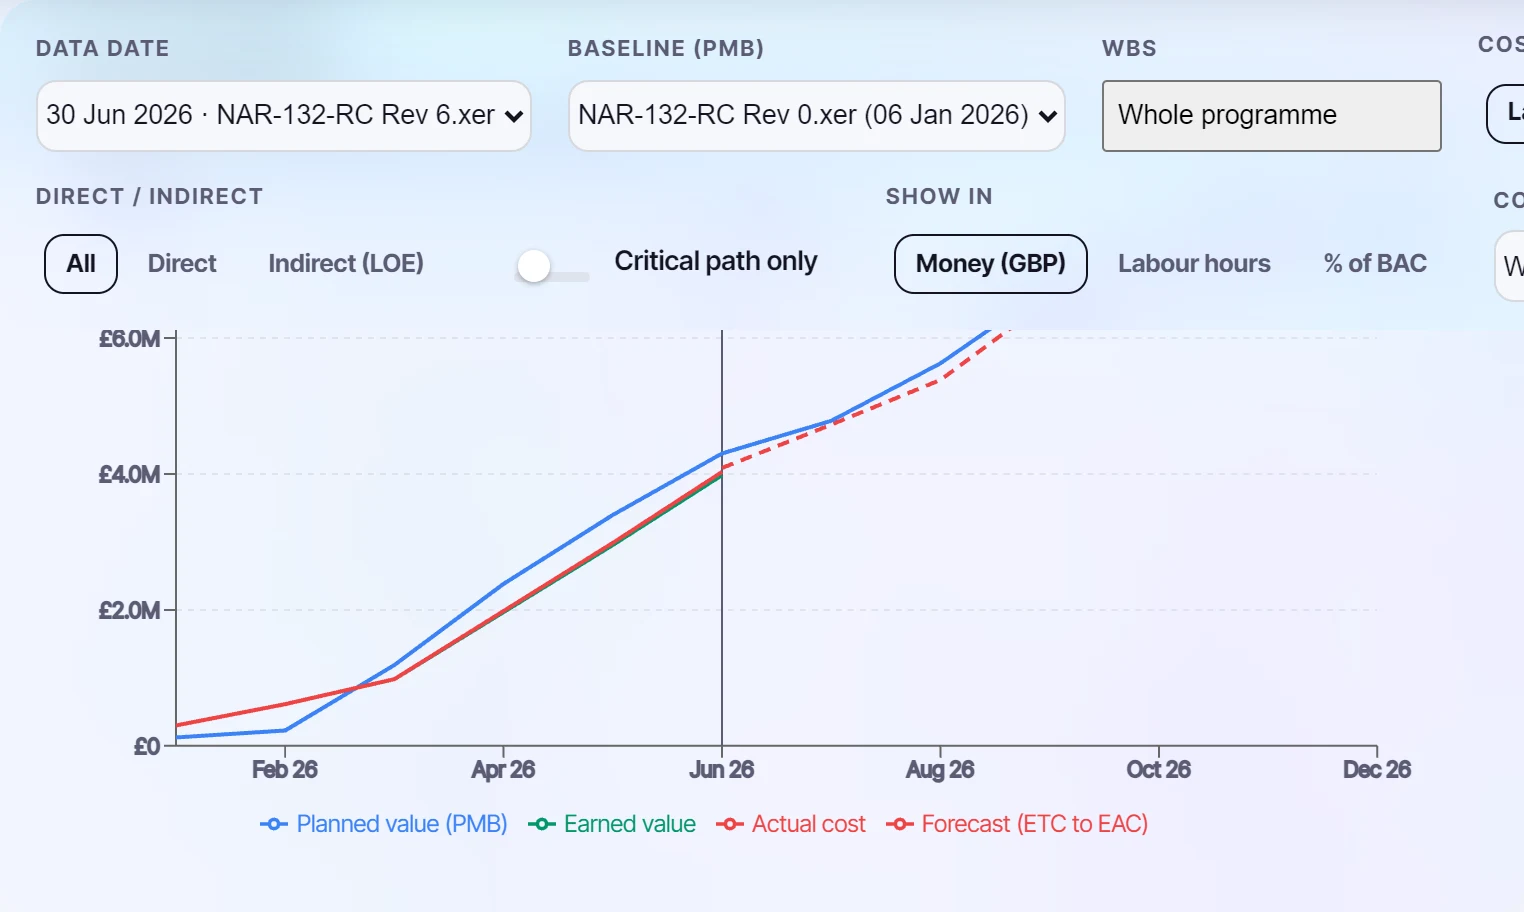
Management reserve isn't in a P6 export, so you enter it, giving the total allocated budget (TAB = BAC + MR). A control account's manager is the WBS node's responsible manager unless you enter one.
Across updates#
Load earlier updates and Trend and forecast shows SPI, CPI and SPI(t) over time, but only where the updates are cost- or resource-loaded, rather than as a misleading 1.00.