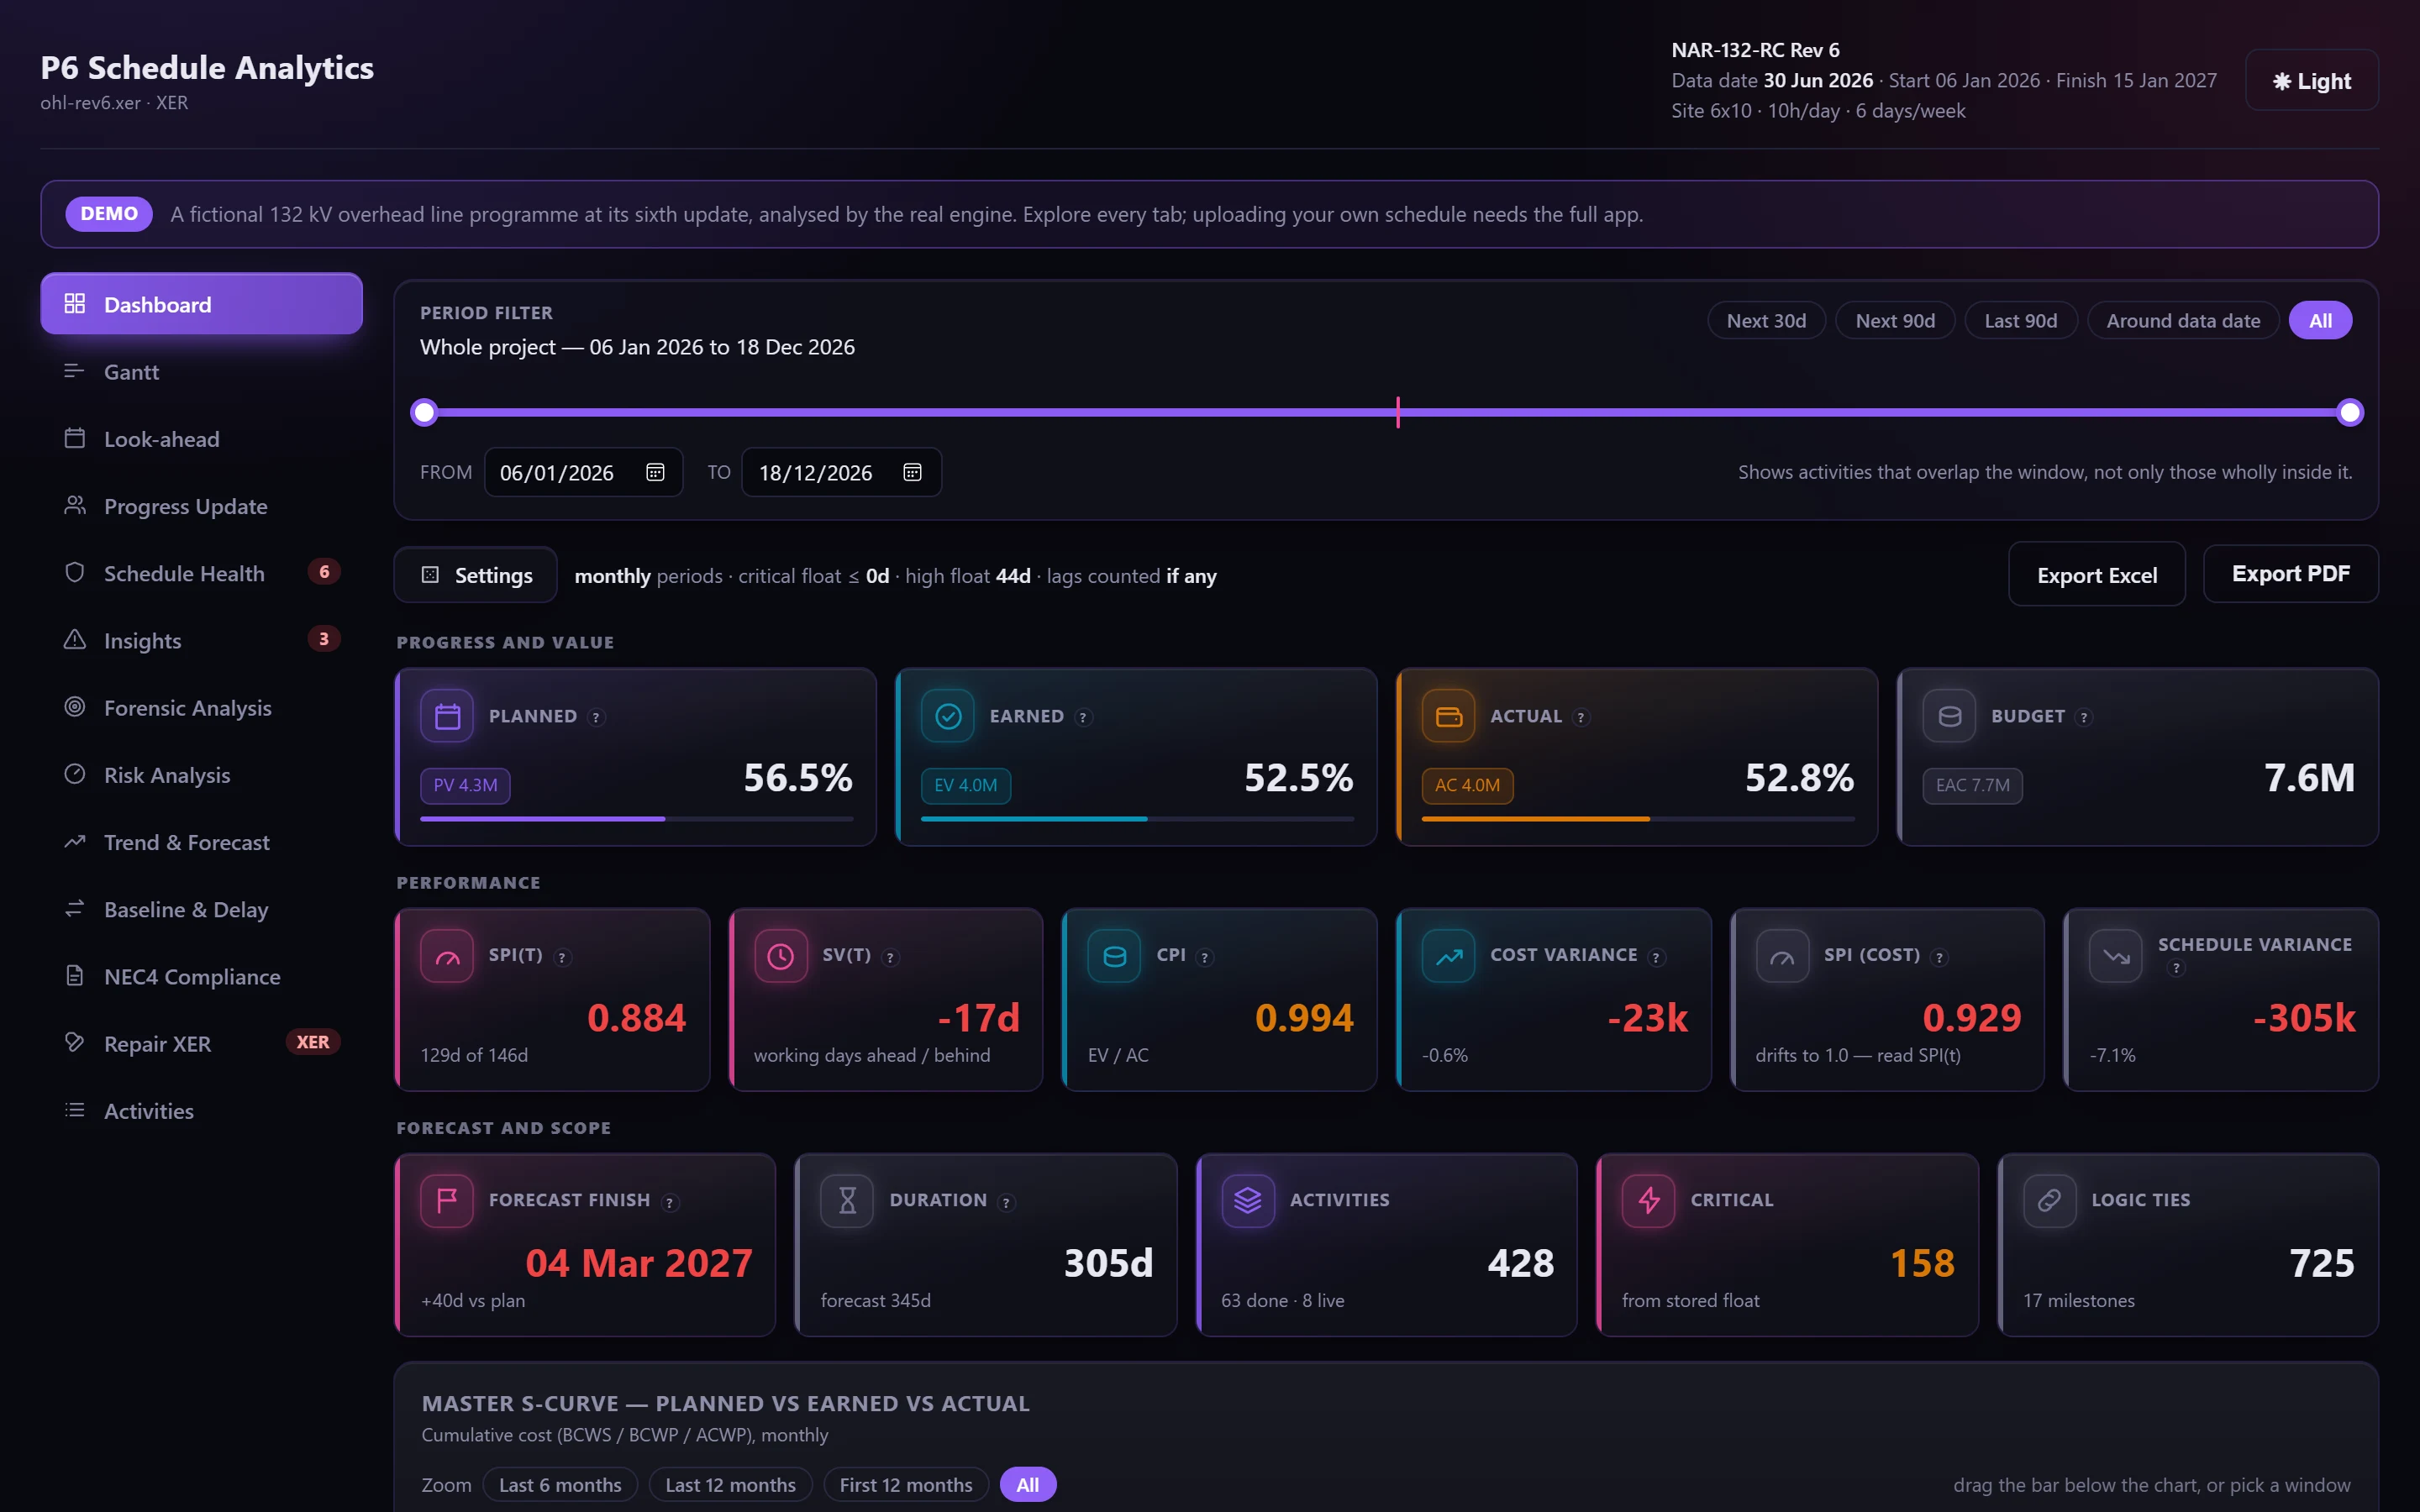
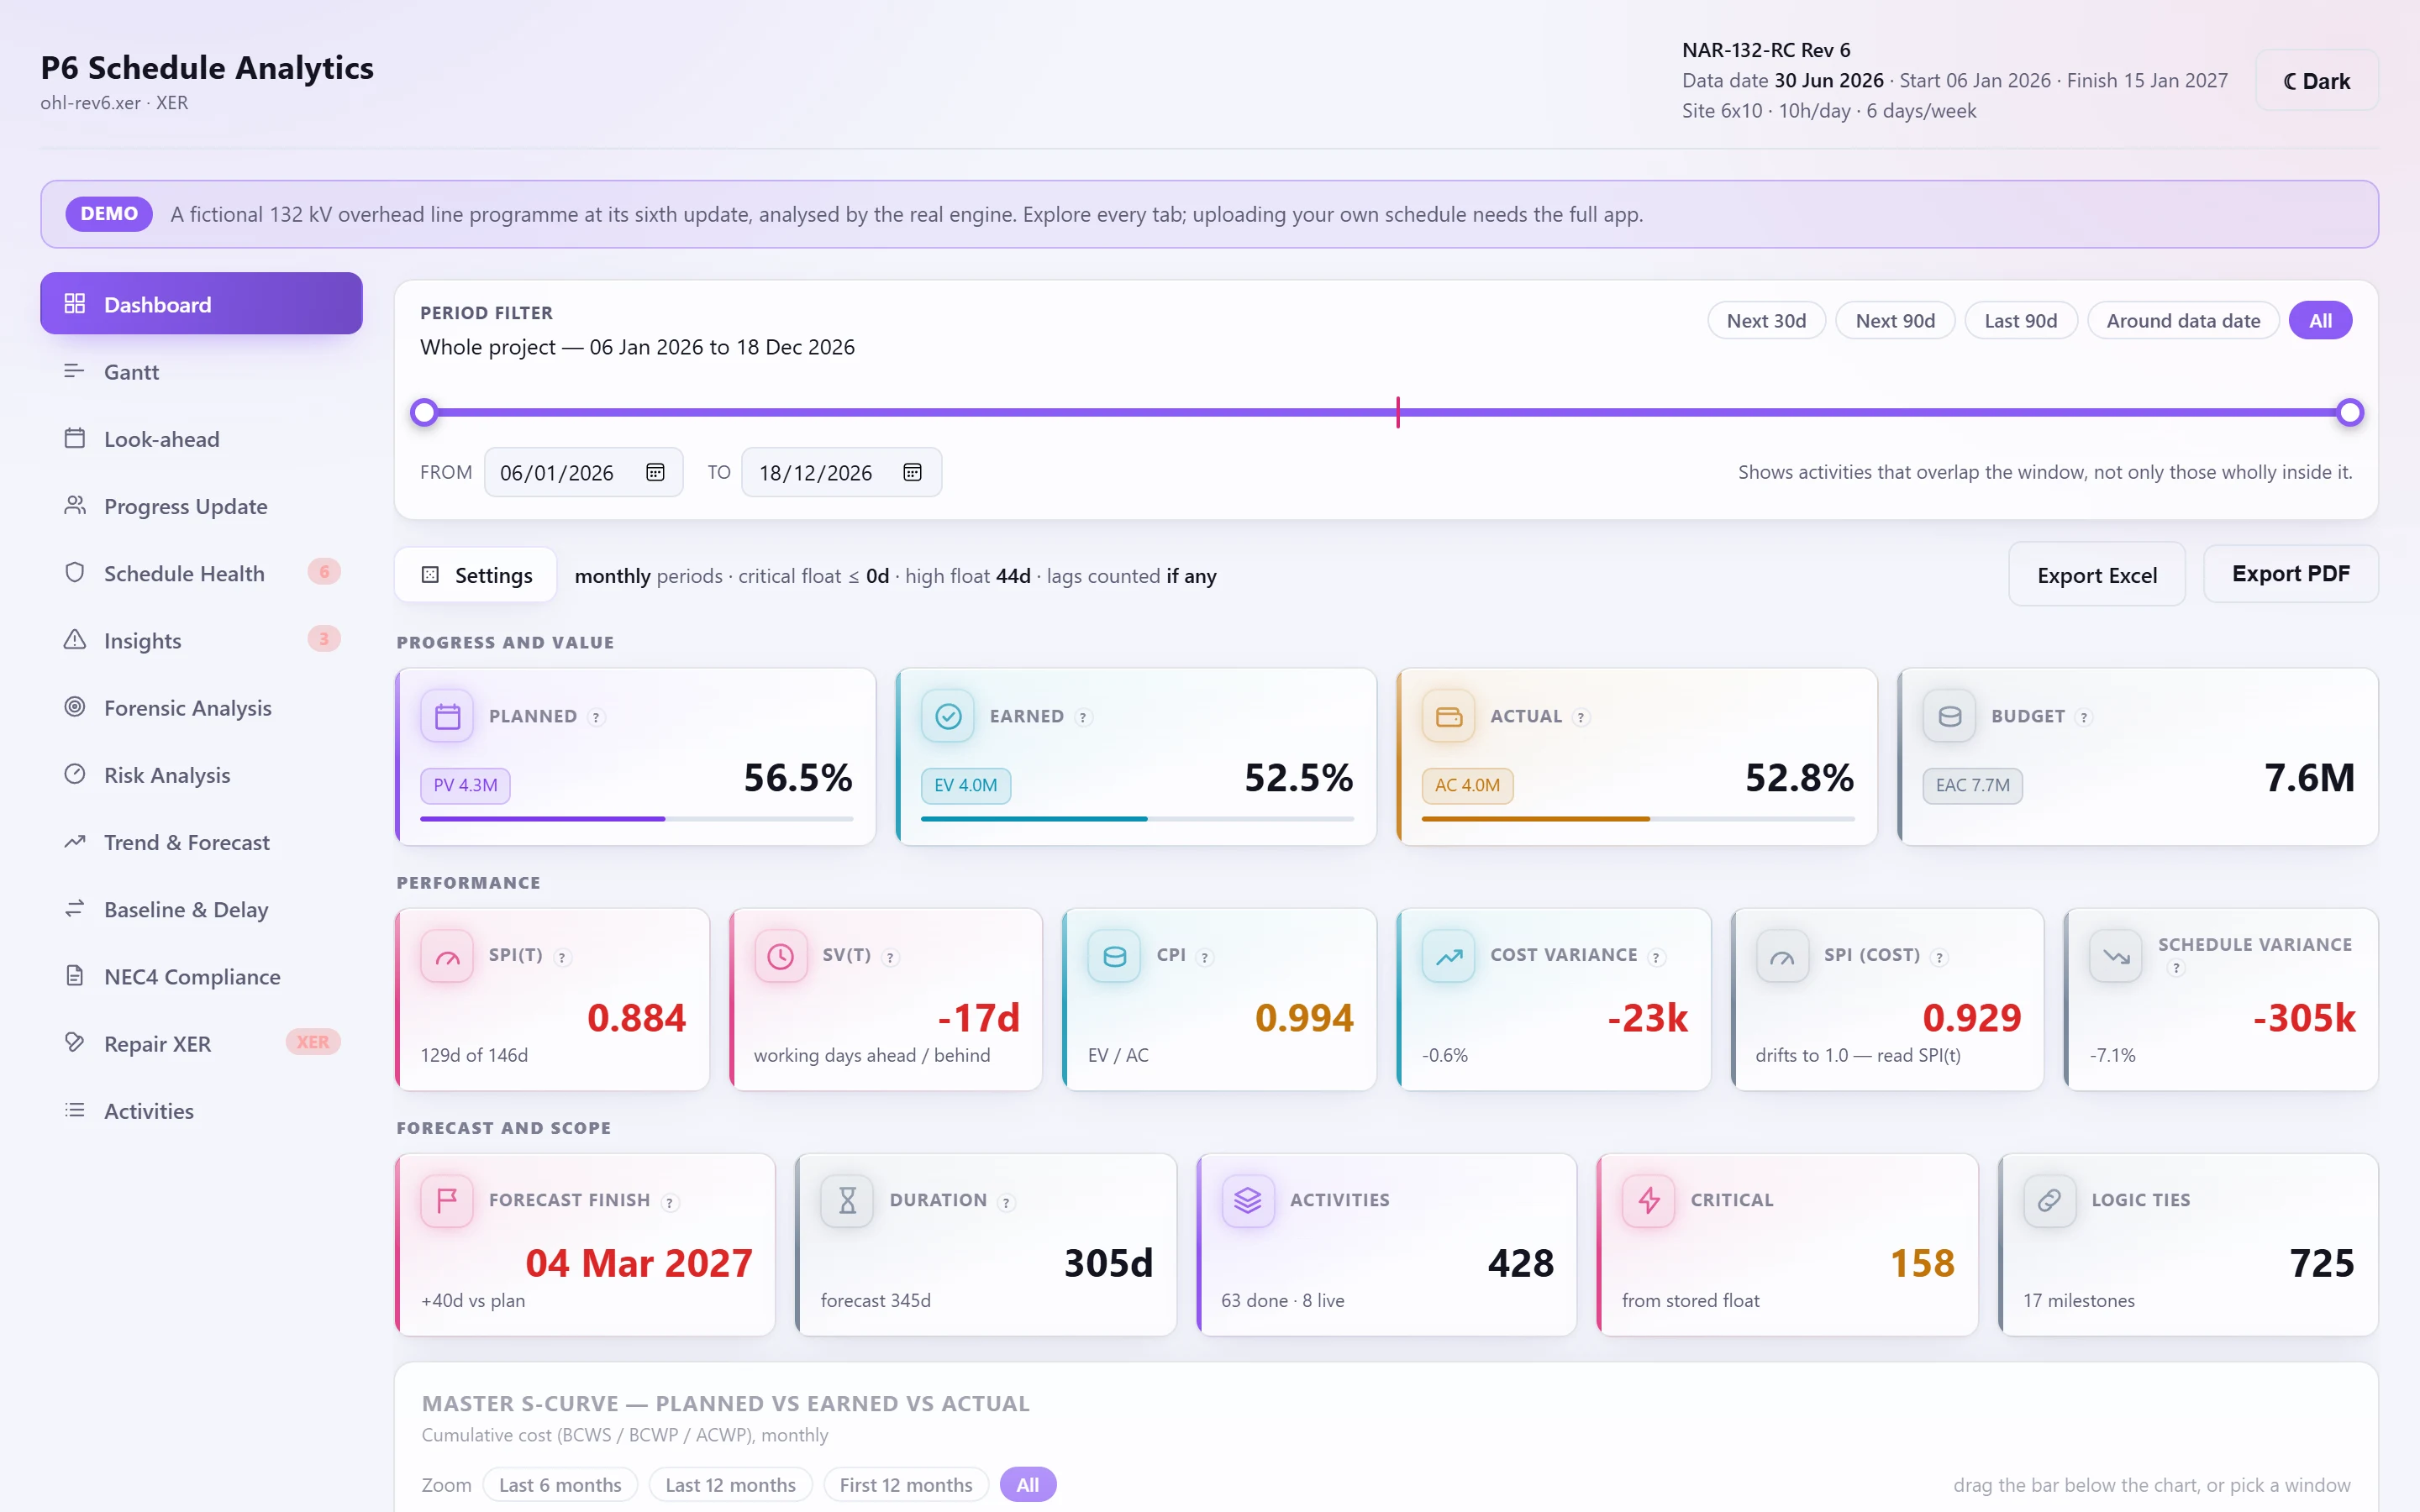
Four headline cards (schedule health, the forecast finish, SPI(t) and work done), the DCMA strip, key milestones and the driving path, with a WBS treemap, workfront density and float erosion below. One filter narrows the Dashboard, Activities, the Gantt and the Look-ahead at once.
What it gives you
Step through every loaded update with the scrubber and see the Dashboard as it stood at each one.
Filter by WBS, activity code, status, float band, resource, insight or failing DCMA check, and every tab follows.
Click a failing DCMA tile, a treemap box or a heatmap cell to filter straight to the work behind it.
Visuals of the whole programme
- WBS treemap: each element sized by budget and coloured by SPI, % complete or worst float.
- Insights by WBS: every finding counted under each WBS element.
- Workfront density: the live work in each week by WBS or resource, with out-of-sequence starts and over-allocation marked.
- Float erosion: open work at each update in critical, near-critical and high float.
Changes since the last update
With an earlier update loaded, each progress and performance figure shows its change, measured like for like. A missing figure is said in words, never shown as a misleading zero.
Check your next update before anyone else does.
Free for a day. Export an XER from P6 and see what it says.