The Earned Value tab reports every measure EIA-748 names, worked out the way P6 works them out: budgets from the baseline, earned value by each WBS element's own technique, and the forecast the way P6 forecasts. Every figure was checked against P6's own on a project using each technique.
What it gives you
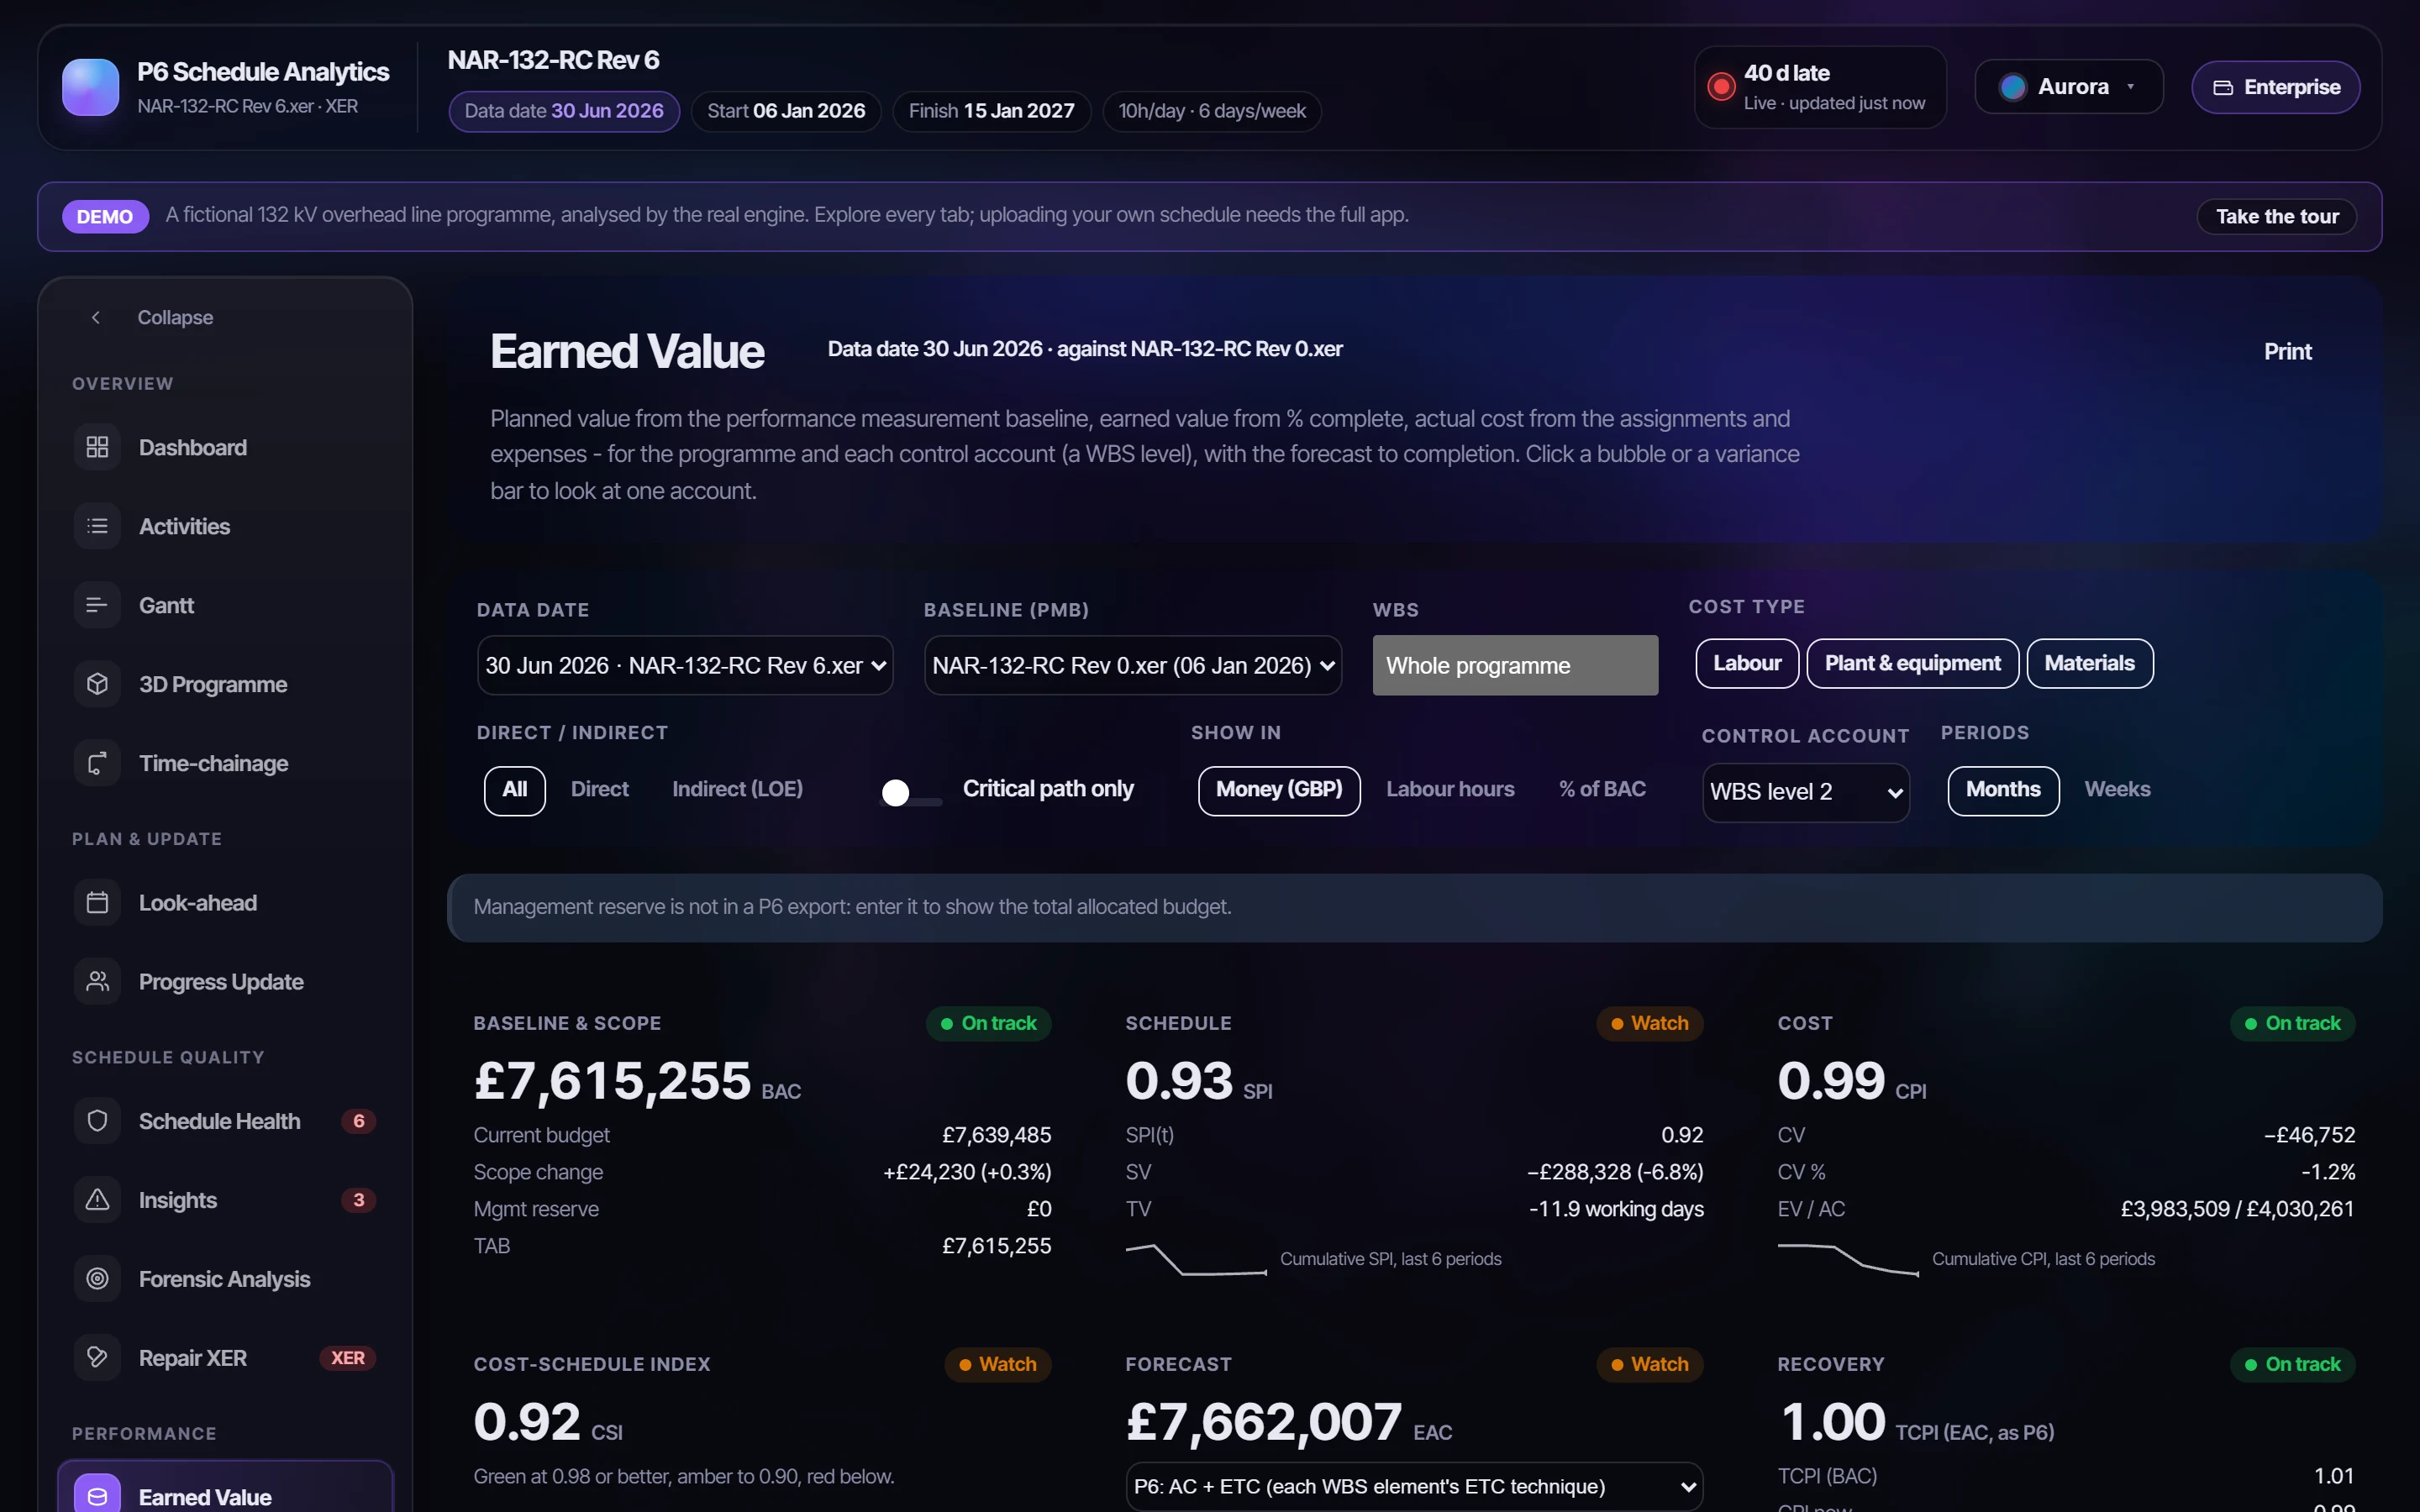
BAC, PV, EV, AC, ETC, EAC, SV, CV, VAC, SPI, CPI and TCPI all matched P6's own figures, for the project and every WBS element.
Control accounts at the WBS level you choose, with CPI against SPI, variance worst first, and a bridge from BAC to EAC.
Earned Schedule gives SPI(t) and the time variance in working days, from the baseline day by day.
The S-curve, as the Earned Value tab draws it.
Planned, earned and actual cost month by month to the data date, and the forecast to Completion beyond it. These are the engine's figures for the fictional overhead line programme: SPI 0.93, CPI 0.99.
At the data date the demo programme has earned £4,007,739 against £4,296,067.41 planned, for an actual cost of £4,030,260.52.
Read the way P6 holds it
- BAC is each activity's baseline budget: resource assignments and project expenses, in money or labour hours.
- Earned value follows the technique each WBS element sets in P6: activity % complete, 0/100, 50/50 or a custom %.
- ETC is P6's remaining cost, or the work left times a performance factor. EAC is AC plus ETC, as P6 works it.
- Money is shown in the currency you view in, at the file's own exchange rates, as P6 shows it.
One page for the whole story
- Six cards (scope, SPI with SPI(t), CPI, CSI, EAC and TCPI), each with its status in words and a six-period trend.
- The S-curve with the forecast from the data date to EAC, and the period's planned, earned and spent on one time axis.
- Click a control account anywhere and the curve, the cards and the table narrow to it.
| Measure | How it is worked out |
|---|---|
| BAC | Σ baseline budget of assignments and expenses (the activity's own budget where it has neither) |
| PV | BAC spread over the baseline's planned dates to the data date |
| EV | BAC × performance % complete, by the WBS element's earned value technique |
| AC | Σ actuals on assignments and expenses |
| ETC · EAC | P6's remaining cost, or (BAC − EV) × a performance factor · AC + ETC |
| SV · CV · VAC | EV − PV · EV − AC · BAC − EAC |
| SPI · CPI · CSI | EV ÷ PV · EV ÷ AC · CPI × SPI |
| TCPI | (BAC − EV) ÷ (EAC − AC), as P6 shows it; towards BAC alongside |
| SPI(t) · SV(t) | Earned schedule ÷ actual time · ES − AT, in working days |
Check your next update before anyone else does.
Free for a day. Export an XER from P6 and see what it says.